


Timeframe: 4h
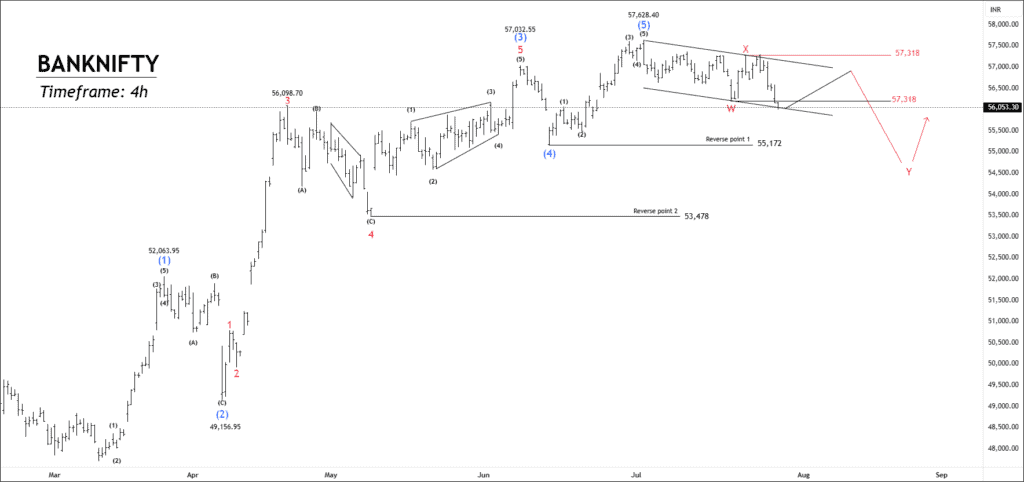
The BANKNIFTY 4-hour chart shows that the market recently completed a 5-wave impulse move, topping near 57,628.40. Following this, a corrective pattern appears to be forming, labeled as a W-X-Y structure. Currently, the index is hovering around 56,053, testing a support line that connects recent lows, and a bounce attempt is visible. If this bounce sustains, we could see a short-term rise toward 57,318, which acts as a resistance level.
However, if the price fails to cross above 57,318 and starts falling again, the next downward wave (Y) could drag the index lower, possibly below the previous low of 55,172. This level corresponds to the prior Wave 4, which may now act as a resistance point. Alternatively, if the decline continues further, the price might reverse from 53,478, which represents the sub-wave 4 of Wave (3).
We will provide further updates soon.
Get free important share market ideas on stocks & nifty tips chart setups, analysis for the upcoming session, and more by joining the below link: Stock Tips
Have you any questions/feedback about this article? Please leave your queries in the comment box for answers.

good pick! Can you teach me to pick stocks?
Exciting! Can’t wait for more ideas like this.
sir i want to buy premium plans. please help me regarding the same.