
Free Stock market / Nifty intraday tips, FREE Stock, Commodity & Forex tips

NSE ABREL – Identifying Trap Scenarios and Confirmation Triggers

Free nse abrel chart calls
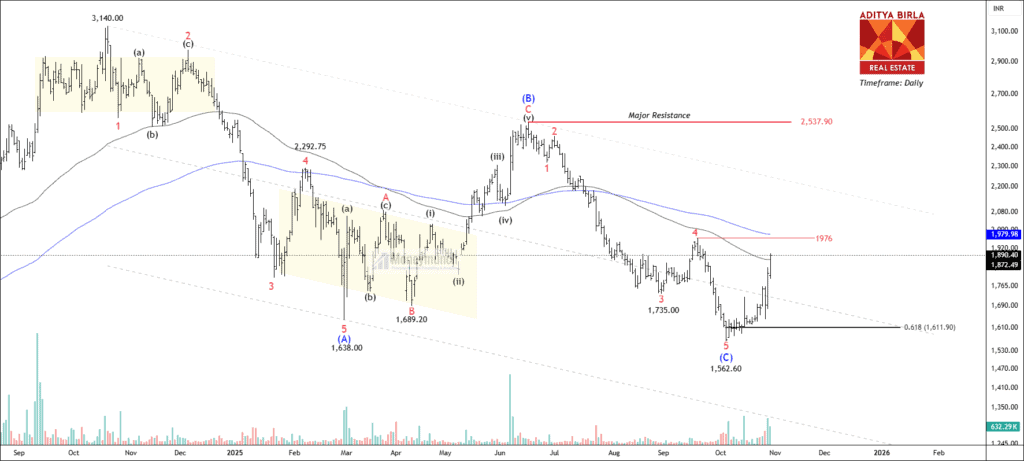
Figure 1. NSE ABREL Elliott Wave Projection with multiple wave counts

NSE ABREL has constructed a corrective A-B-C formation on the daily timeframe chart. The price has fallen 50% from the all-time high of 3410 within 13 months. Wave (B) occurred at 2537.9, where Wave (c) completed the 5-wave cycle at 1635. If the price breaks and closes above 1976, traders can buy for the following targets: 2080 – 2140 – 2185+.

Why can’t we label it early?

  • We can assume wave (C) is 100% agreed upon without any confirmation. It can be a huge mistake if the price falls below 1880 again; this could signal a complex corrective extension.
  • Our targets are up to the upper band only because the alternate count says this bounce might still be a wave 4. The move is sharp, but corrective wave 4 rallies often look impulsive.
  • The trend remains down until the channel is broken.

Important Factors:

Volume Analysis:
Volume on the latest bars is increasing, but not enough to scream “trend reversal”. We need a volume breakout, not just price.

Failure Zone:
Rejection at 1976 = Ugly pullback to 1730 -1700.

Invalidation:
Closing below the Fibonacci retracement 0.618 at 1611 will make this count invalid due to the formation of new lower lows.

Alternative count:
We will look for one more downward move of the ending diagonal (Wave E) before printing the bottom!

Premium subscribers will get further information soon.

Get free important share market ideas on stocks & nifty tips chart setups, analysis for the upcoming session, and more by joining the below link: Stock Tips

Have you any questions/feedback about this article? Please leave your queries in the comment box for answers.

Disclaimer: The information provided on this website, including but not limited to stock, commodity, and forex trading tips, technical analysis, and research reports, is solely for educational and informational purposes. It should not be considered as financial advice or a recommendation to engage in any trading activity. Trading in stocks, commodities, and forex involves substantial risks, and you should carefully consider your financial situation and consult with a professional advisor before making any trading decisions. Moneymunch.com and its authors do not guarantee the accuracy, completeness, or reliability of the information provided, and shall not be held responsible for any losses or damages incurred as a result of using or relying on such information. Trading in the financial markets is subject to market risks, and past performance is not indicative of future results. By accessing and using this website, you acknowledge and agree to the terms of this disclaimer.
Previous ArticleNext Article
Mr.Guru(s) is a team of stock market certified technical and research analysts with over 20 years of experience. They are regular guests on popular online channels and contribute articles to several financial publications. Their insights and advice are respected by investors worldwide. With their collective knowledge and expertise, they have a proven track record of successfully predicting market movements and identifying profitable opportunities.

Join Today (Free): Stock & Nifty Tips

Write a Comment

Comment Policy: We love comments and appreciate the time that readers spend to share ideas and give feedback. However, all comments are manually moderated and those deemed to be spam or solely promotional will be deleted. Your email address will not be published. Required fields are marked *