

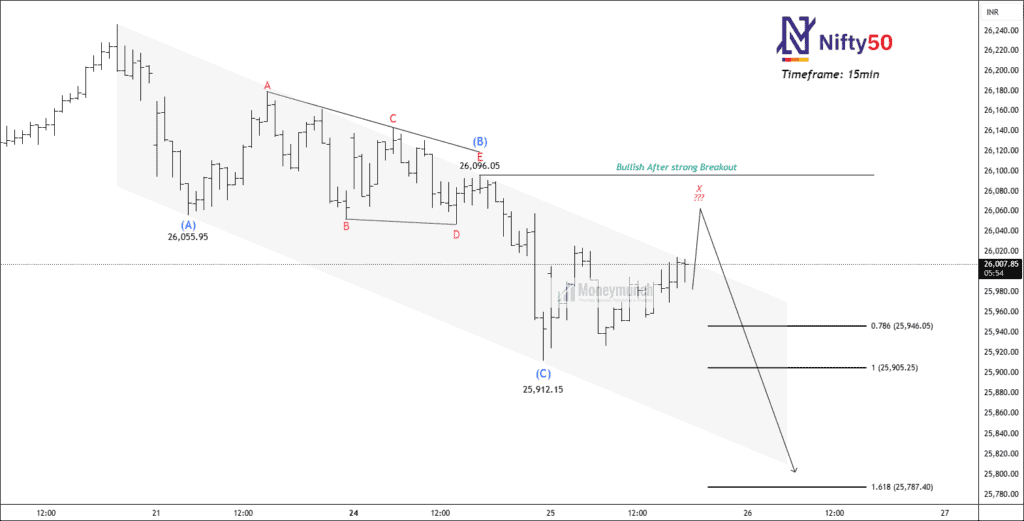

Wave Insight:
- We have a clear A-B-C corrective structure inside a down channel. The current small consolidation is labelled as Wave D → E (E being the short-term top inside the corrective pattern).
- A decisive breakout above Wave E (26,100) would invalidate the immediate bearish bias and signal a bull dominance.
- If price fails Wave E (rejection under 26,100), expect the dominant down trend to resume and price to seek lower Fibonacci targets.
Key levels:
- Bullish breakout level: 26,100 (break + hold above required for bullish confirmation)
- Immediate resistance if breakout occurs: horizontal line near 26,100–26,120 (the breakout line on the chart)
Downside targets on failure:
- 0.786 retrace area 25,946
- 1.00 measured levels 25,905
- 1.618 extension 25,787 (deeper extension; if momentum is strong, price may go below this)
- Crucial level: 25,750. If price breaks below this, a stronger bearish continuation is likely.
Trade plan
- Bull case (only if): wait for a clean breakout candle close above 26,100 with volume/confirmation (15-min close, then retest). After confirmation, consider long entries targeting initial resistance 26,200 – 26,300 and re-evaluate on the way. Use tight stops below the breakout retest low.
- Bear case (probable unless breakout): If price rejects at 26,100 and fails to sustain above, consider short bias with targets at 25,946, 25,905, and 25,787. Place stop-loss just above the rejection high (for example, a few ticks above 26,120).
- Risk management: keep size small until breakout/rejection clarity; prefer confirmed closes (15-min) rather than wicks.
Conclusion:
- Price is trading inside a falling channel, showing weakness.
- The market becomes bullish only if it breaks and holds above 26,100.
- If the price fails to cross 26,100, the downtrend is expected to continue. Possible downside levels are 25,950, 25,900, and 25,780.
- A drop below 25,750 would confirm stronger bearish pressure.
Get free important share market ideas on stocks & nifty tips chart setups, analysis for the upcoming session, and more by joining the below link: Stock Tips
Have you any questions/feedback about this article? Please leave your queries in the comment box for answers.
Disclaimer: The information provided on this website, including but not limited to stock, commodity, and forex trading tips, technical analysis, and research reports, is solely for educational and informational purposes. It should not be considered as financial advice or a recommendation to engage in any trading activity. Trading in stocks, commodities, and forex involves substantial risks, and you should carefully consider your financial situation and consult with a professional advisor before making any trading decisions. Moneymunch.com and its authors do not guarantee the accuracy, completeness, or reliability of the information provided, and shall not be held responsible for any losses or damages incurred as a result of using or relying on such information. Trading in the financial markets is subject to market risks, and past performance is not indicative of future results. By accessing and using this website, you acknowledge and agree to the terms of this disclaimer.
