

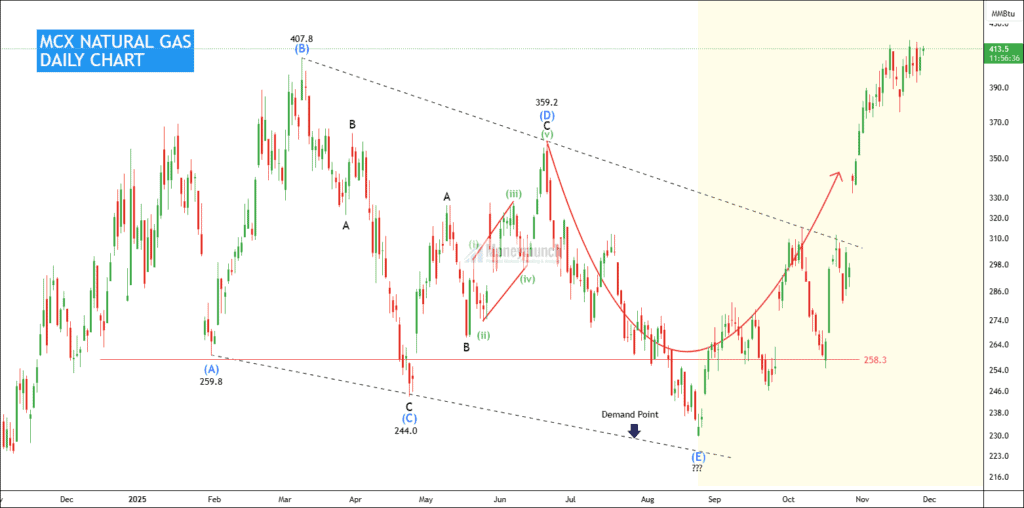
Did you trade the MCX natural gas wave projection?
Click here: MCX Natural Gas – Is Wave (E) Bottoming Out?

Figure 1. MCX Natural Gas BEFORE chart
We had written clearly, “The chart suggests a potential bounce, targeting the following levels 275 – 300 – 320 – 350 in the medium term.”

Figure 2. MCX Natural Gas AFTER chart
Timeline:
- First update:
8 September 2025MCX reached the first target of 275. - Second update:
1 October 2025The price touched the second target of 300. - Third update:
29 October 2025The price hit the third target of 320. - Final update:
29 October 2025MCX Natural gas achieved the final target of 350.
👉 If you had traded this setup even for the second target, you could have made more than 160 points in this swing setup.
Get free MCX ideas, chart setups, and analysis for the upcoming session: Commodity Tips →
Have you any questions/feedback about this article? Please leave your queries in the comment box for answers.
Disclaimer: The information provided on this website, including but not limited to stock, commodity, and forex trading tips, technical analysis, and research reports, is solely for educational and informational purposes. It should not be considered as financial advice or a recommendation to engage in any trading activity. Trading in stocks, commodities, and forex involves substantial risks, and you should carefully consider your financial situation and consult with a professional advisor before making any trading decisions. Moneymunch.com and its authors do not guarantee the accuracy, completeness, or reliability of the information provided, and shall not be held responsible for any losses or damages incurred as a result of using or relying on such information. Trading in the financial markets is subject to market risks, and past performance is not indicative of future results. By accessing and using this website, you acknowledge and agree to the terms of this disclaimer.
