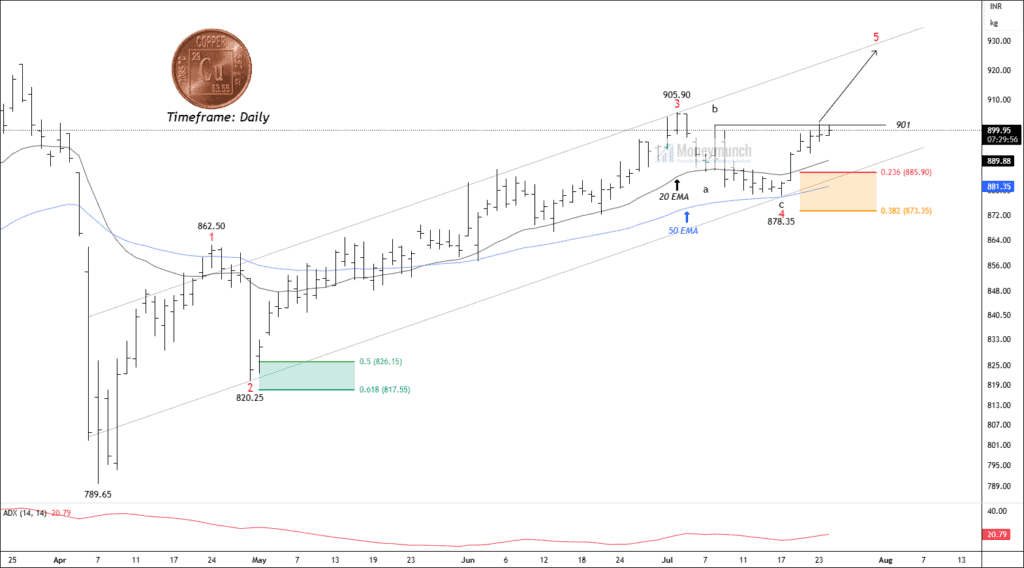

Timeframe: Daily
MCX Copper shows a developing Elliott Wave structure. Wave 1 topped at 862.50, followed by a correction to 820.25 in Wave 2, which held within the 0.5 to 0.618 Fibonacci zone. A strong bullish Wave 3 then pushed prices up to 905.90, after which a standard ABC correction occurred. Wave 4 seems to have completed at 878.35, near the 0.382 retracement level. Now, copper is trading just below the key breakout level of 901, and a breakout above this could confirm the start of Wave 5.
The ADX indicator currently reads 20.79, indicating a weak trend. For the expected bullish move to gain strength, ADX needs to rise above 25. The ATR suggests moderate volatility, with stable candle sizes supporting a gradual move. If prices sustain wave b at 901, Wave 5 may unfold with upside targets at 913 – 919 – 927+. Note that a failure here would result in a new swing low, completing the final leg of the flat correction for wave 4.
We will update further information for premium members soon.
Get free MCX ideas, chart setups, and analysis for the upcoming session: Commodity Tips →
Have you any questions/feedback about this article? Please leave your queries in the comment box for answers.
Sir was waiting for the stock of the month
Amazing analysis as usual.