


Timeframe: Daily
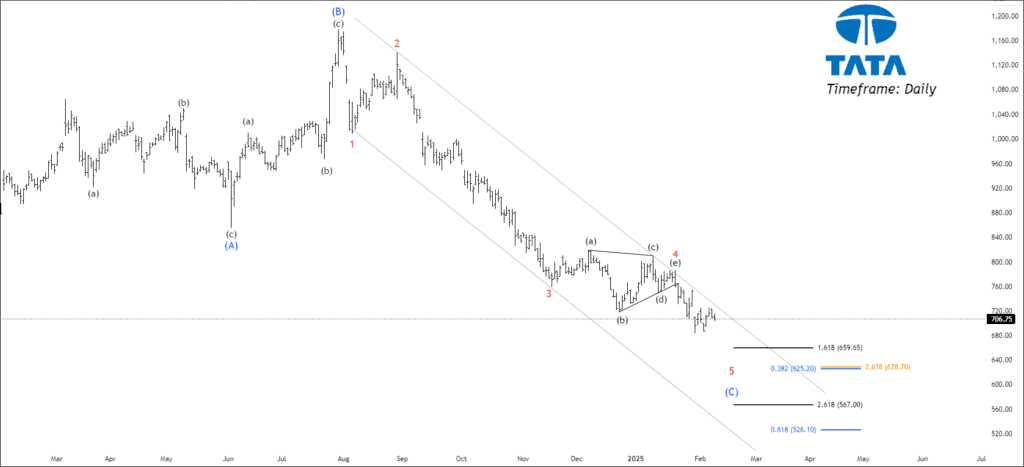
Tata Motors (NSE) has been in an expanded flat correction pattern for the past 11 months. In this pattern, the highest high (HH) was 1179, and the lowest low (LL) was 683.2. Currently, the price is trading below the 200, 100, and 50 EMA levels, indicating a bearish trend.
In this expanded flat correction:
- Wave (A) completed at 855.4,
- Wave (B) peaked at 1179,
- Sub-wave 4 of Wave (C) touched 786.65,
- Sub-wave 5 is now unfolding.
Once Wave 5 is completed, traders can look for buying opportunities with target levels at 799 – 951 – 1050+. First, it’s crucial to identify the end of Wave (C) to confirm the correction’s completion and a bullish reversal.
Projecting ending point of wave (C):
- Wave (C) may end at 2.618% of Wave (A) around 628.7.
- Wave 5 has multiple potential targets/support levels:
- 0.618 extension of Wave 1 at 526,
- 0.382 extension of Wave 1 at 628,
- 1.618 reverse Fibonacci of Wave 4 at 657,
- 2.618 reverse Fibonacci of Wave 4 at 562.
Only premium subscribers will have access to further information
 Unlock This Article
Get free forex & currency ideas, chart setups, and analysis for the upcoming session: Forex Signals →
Want to get premium trading alerts on GBPUSD, EURUSD, USDINR, XAUUSD, etc., and unlimited access to Moneymunch? Join today and start potentially multiplying your net worth: Premium Forex Signals
Premium features: daily updates, full access to the Moneymunch #1 Rank List, Research Reports, Premium screens, and much more. You΄ll quickly identify which commodities to buy, which to sell, and target today΄s hottest industries.
Have you any questions/feedback about this article? Please leave your queries in the comment box for answers.

As analyst, This is exactly the kind of content traders need. You’ve clearly explained how the expanded flat correction is affecting Tata Motors’ price action. Identifying the potential end of Wave (C) at 628.7 and various Wave 5 targets is super helpful. I’ll definitely be using these levels in my trading strategy. Appreciate your hard work in simplifying such complex patterns!
Hope Tata Motors reverses soon! Targets look promising.
This clarified a lot about expanded flat patterns. Good job!
Interesting use of Fibonacci levels. Keeping an eye on 628!
Clear and concise analysis. Waiting for Wave (C) to settle!
Now tatamotor touched 535/- now what next?