

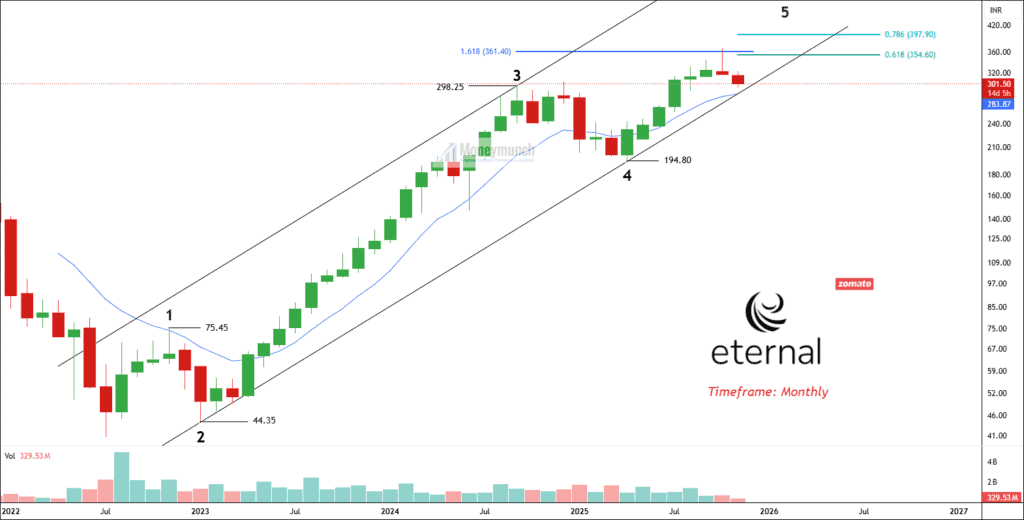

NSE ETERNAL has started an impulsive formation from the low of 75.45. The monthly chart gives traders a clear edge for identifying the recent correction. At a glance, price has completed wave 4 at 194.80 and has started forming impulsive wave 5. The recent fall from 368.45 causes confusion, whether wave 5 is accomplished or not.
Although the fall can be sub-wave 4 of wave 5, Following Fibonacci levels supports the end of wave 5:
- 1.618 Fibonacci multiple of wave 4 at 361.40.
- 61.8% Fibonacci extension of wave 1 through 3 at 354.6.

As per the chart, we have marked the recent high of 368.45 as sub-wave (3) of wave 5. The horizontal line drawn is the major monthly resistance channel where the price has never broken out and made an excess & reversal.
We will expect the correction to be sharp because wave (2) was a complex correction. The ending point of the wave can be 0.618 to 0.50 Fibonacci range or the gap fulfillment.
We will update further information after gathering another piece of information with fresh wave counts.
Get free important share market ideas on stocks & nifty tips chart setups, analysis for the upcoming session, and more by joining the below link: Stock Tips
Have you any questions/feedback about this article? Please leave your queries in the comment box for answers.

Detailed report, WELL DONE.
can you analyse finnifty with intraday targets?