This is the 46th Day course in a series of 60-Days called “Technical Analysis Training“
You will get daily one series of this Training after 8 o’clock night (Dinner Finished)
Follow MoneyMunch.com Technical Analysis Directory and Learn Basic Education of Technical Analysis on the Indian Stock Market (NSE/BSE)

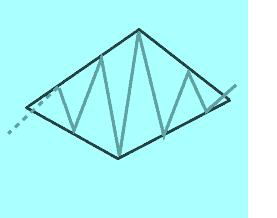
Flag Bearish Chart Pattern
Implication
A Flag (Bearish) is considered a bearish signal, indicating that the current downtrend may continue.
Description
A Flag (Bearish) follows a steep, or nearly vertical decline in price, and consists of two parallel trendlines that form a rectangular flag shape. The Flag can be horizontal (as though the wind is blowing it), however it often has a slight upward trend.
The vertical downtrend, that precedes a Flag, may occur because of buyers’ reactions to an unfavorable company announcement, such as a court case, or a sudden and unexpected departure of a CEO. The sharp price decrease is sometimes referred to as the “flagpole” or “mast”.

The rectangular flag shape is the product of what technical analysts refer to as consolidation. Consolidation occurs when the price seems to bounce between an upper and lower price limit. The Flag (Bearish) pattern formation reflects the reaction of sellers who are willing to sell at a lower cost, and the influx of buyers who inadvertently drive up the price as they compete to buy at the best possible price.
A bearish signal occurs when the price rebounds beyond the lower trendline of the Flag formation, and continues the original downward price movement. This is considered a pattern confirmation.
When speaking about Flags, technical analysts may use jargon and refer to the flag as “flying at half-mast”. Visually, this reference is nothing like a flag at half-mast, such as on a day of national mourning. Instead, this term refers to the location of the flag – at the mid-point of what would otherwise be a continuous downtrend.
Important Characteristics
Following are important characteristics for this pattern.
Trendlines
Flags are very similar to Pennants. However, with a Flag, the price trendlines tend to run parallel, whereas with a Pennant, the price trendlines tend to converge. John J. Murphy notes that a price drop below the lower trendline may indicate the resumption of the downtrend.
Volume
As the Flag develops, the volume tends to decrease. However, you will often notice a sharp spike in volume at the end of a Flag, whether it is bearish or bullish.
Duration of the Pattern
Martin Pring notes in his book, Technical Analysis Explained that “Flags can form in a period as short as 5 days or as longs as 3 to 5 weeks.” John J. Murphy identifies that Flags “often last no longer than one or two weeks.”
Trading Considerations
Possibility of Price Reversal
In some rare cases, the price will break against the original price movement, and create a reversal trend. The pattern reversal may be signaled during the Flag formation by a pattern of increasing volume, as opposed to the more typical decrease.
Duration of the Pattern
The duration of the pattern depends on the extent of the price fluctuations (consolidation). The greater the fluctuations, the longer a pattern will take to develop.
Target Price
It is commonly held that the length of the flagpole indicates the potential price decrease. When the Flag completes, the price typically jumps to replicate the height of the original flagpole, while continuing in the direction of the inbound trend.
Criteria that Supports
Volume
Volume should diminish noticeably as the pattern forms.
A strong volume spike on the day of the pattern confirmation is a strong indicator in support of the potential for this pattern. The volume spike should be significantly above the average of the volume for the duration of the pattern. In addition, the volume over the course of the pattern should be declining on average.
Criteria that Refutes
Duration of the Pattern
According to Martin Pring, a pattern that exceeds “4 weeks to develop should … be treated with caution”. After 4 weeks, interest in the stock is likely to decrease to point that it is unlikely to continue in a strong downtrend.
No Volume Spike on Breakout
The lack of a volume spike on the day of the pattern confirmation is an indication that this pattern may not be reliable. In addition, if the volume has remained constant, or was increasing, over the duration of the pattern, then this pattern should be considered less reliable and may actually reverse.
Long Inbound Trend
Shabacker writes that, “When a mast is long … and it’s Flag relatively small, we should naturally expect the movement to be pretty well exhausted when its indicated objective is reached.” He suggests that when you observe this formation, and a price continuation occurs, it is best to use the flagpole as a “yard-stick” to indicate the level at which to “take profits, step aside, and watch for further chart developments.”
Underlying Behavior
This pattern is effectively a pause in a downtrend. The price has gotten ahead of itself with a steep rise; therefore market activity takes a break before continuing the downtrend. This pause is reflected in the decreasing trading volume. Similarly, a spike in volume marks the resumption of the downtrend.
Message for you(Trader/Investor): Google has the answers to most all of your questions, after exploring Google if you still have thoughts or questions my Email is open 24/7. Each week you will receive your Course Materials. You can print it and highlight for your Technical Analysis Training.
Wishing you a wonderful learning experience and the continued desire to grow your knowledge. Education is an essential part of living wisely and the Experiences of life, I hope you make it fun.
Learning how to profit in the Stock Market requires time and unfortunately mistakes which are called losses. Why not be profitable while you are learning?
 Trading Considerations
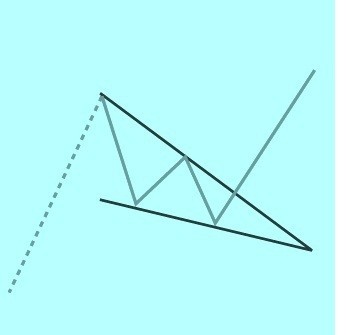
.jpg")
