NSE ADANIENT – Elliott Wave Projection

Free nse adanient daily chart calls

Timeframe: Daily
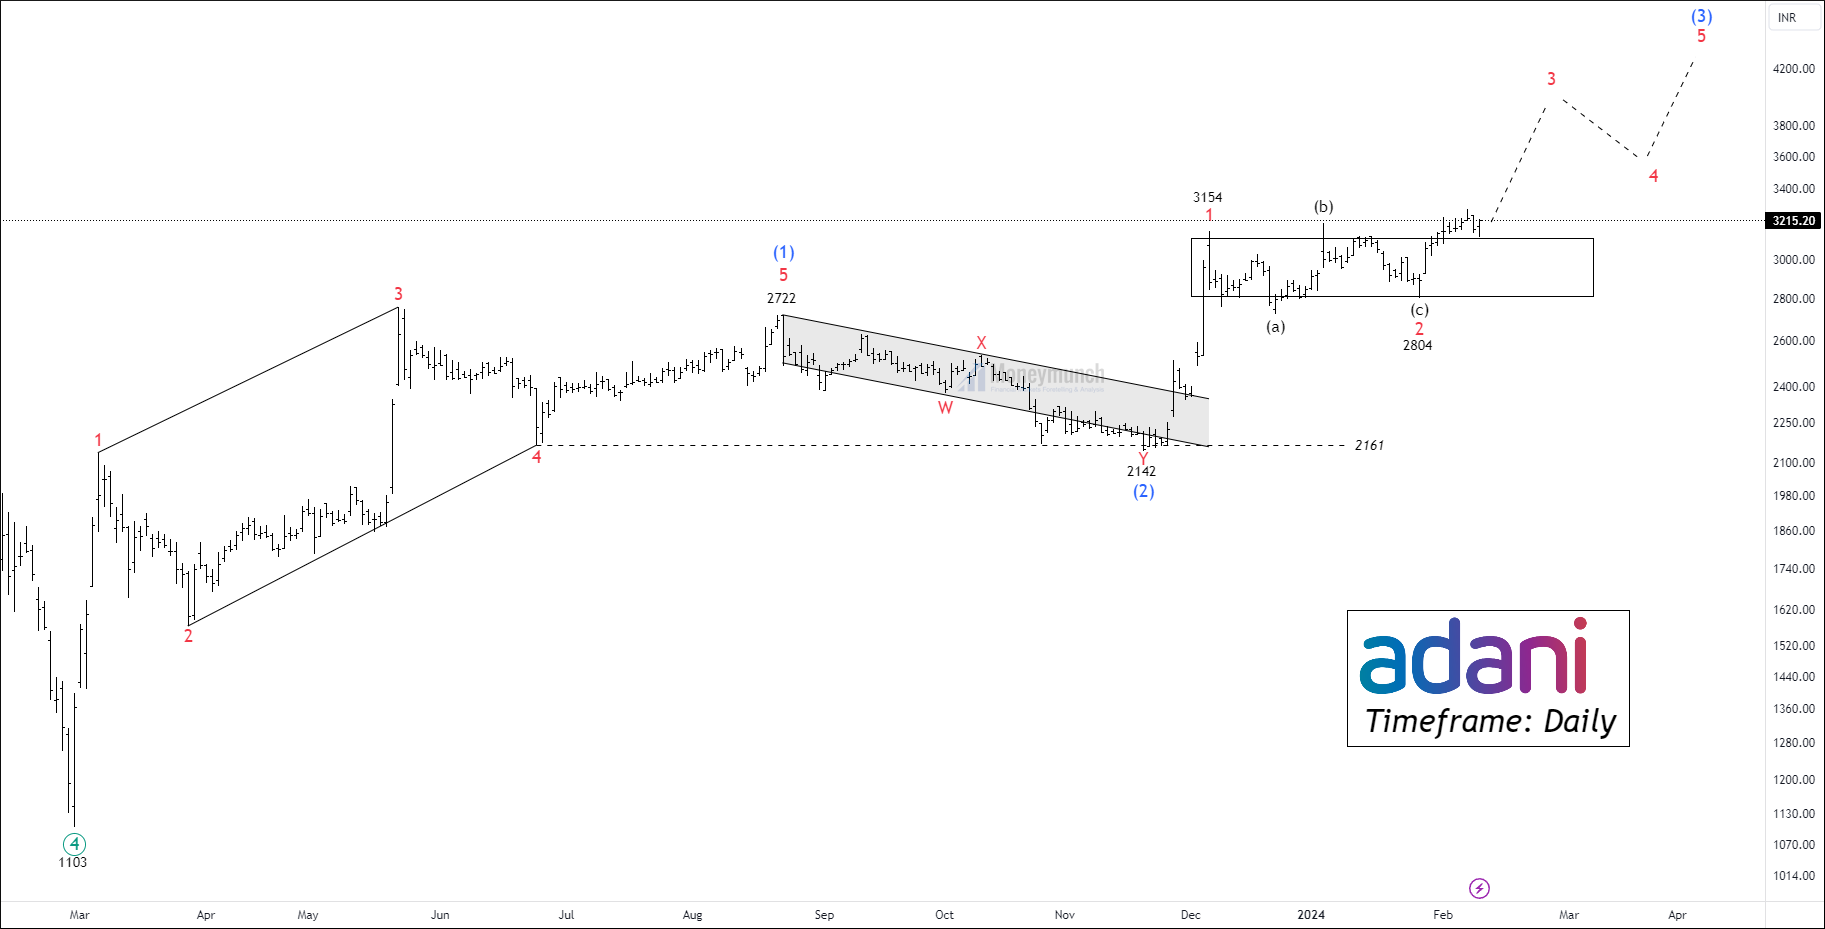
NSE ADANIENT had accomplished wave ((4)) at 1103 and started rising upward. The Average direction index is 34, which indicates the current trend is strong. Price has taken support from 50 SMA and trading above 200 EMA.

As per Elliott wave projection, The start of an impulse was a bit painful. Price constructed a leading diagonal on the wave (1). Wave (2) was a double zigzag because of the sharpness of the current trend. Price broke out wave (1) and established a building block of wave (3). Traders can count sub-waves 1 and 2 of wave (3). Wave (3) can occur at 4442 is 1.618% of wave (1). Possible targets of wave (3) are 3430 – 3816 – 4440+. Note that price may take time and form consolidation and break approach to reach the targets. Traders should wait for a pullback after every breakout.

We will update further information soon.

Get free important share market ideas on stocks & nifty tips chart setups, analysis for the upcoming session, and more by joining the below link: Stock Tips

Have you any questions/feedback about this article? Please leave your queries in the comment box for answers.
Disclaimer: The information provided on this website, including but not limited to stock, commodity, and forex trading tips, technical analysis, and research reports, is solely for educational and informational purposes. It should not be considered as financial advice or a recommendation to engage in any trading activity. Trading in stocks, commodities, and forex involves substantial risks, and you should carefully consider your financial situation and consult with a professional advisor before making any trading decisions. Moneymunch.com and its authors do not guarantee the accuracy, completeness, or reliability of the information provided, and shall not be held responsible for any losses or damages incurred as a result of using or relying on such information. Trading in the financial markets is subject to market risks, and past performance is not indicative of future results. By accessing and using this website, you acknowledge and agree to the terms of this disclaimer.

Part 1 – Monthly Examination of EUR/USD Utilizing Varied Approaches

Free forex EURUSD chart calls

Price action Breakdown Analysis:

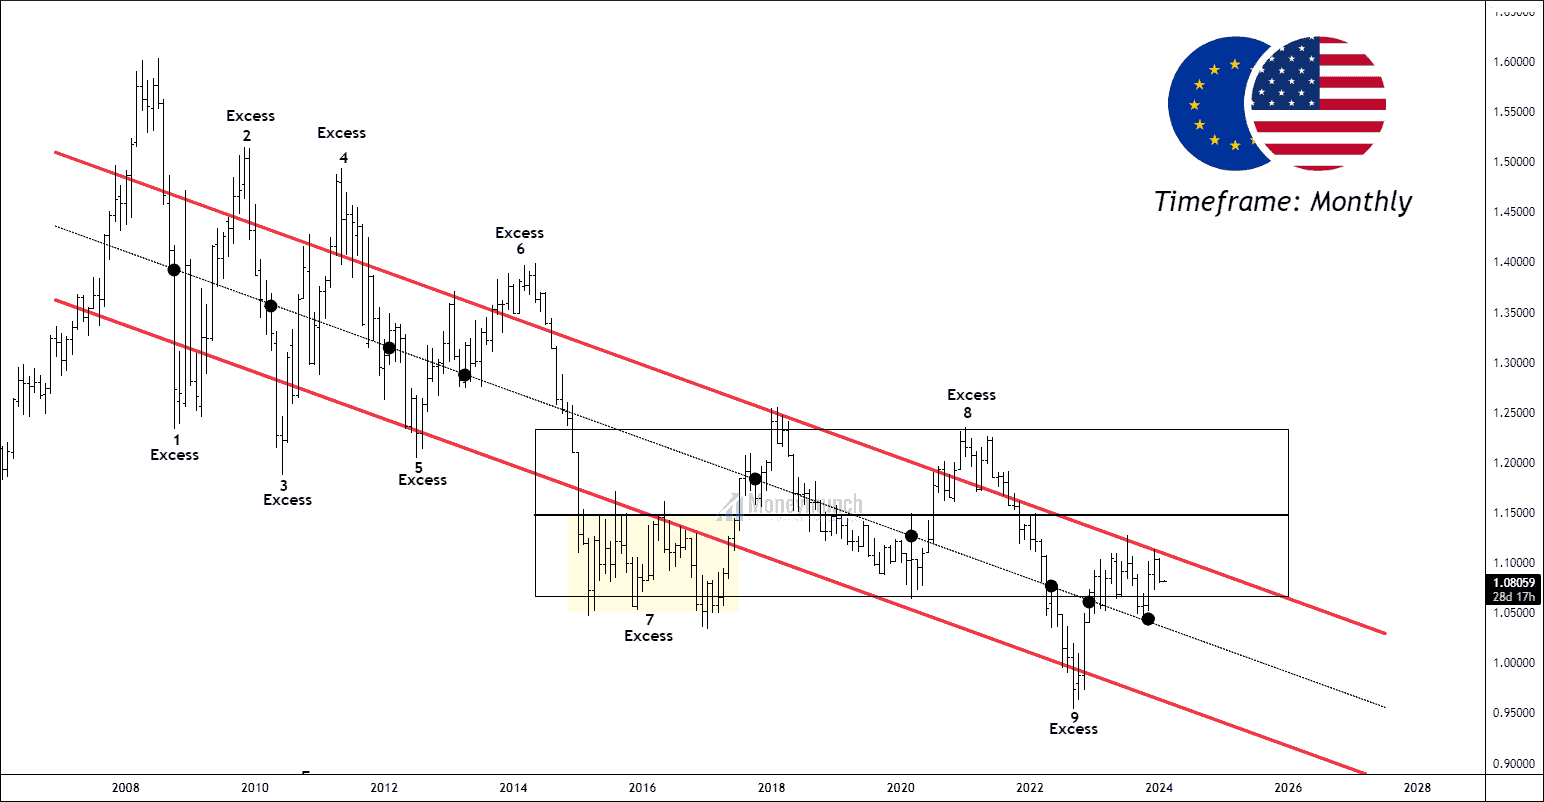
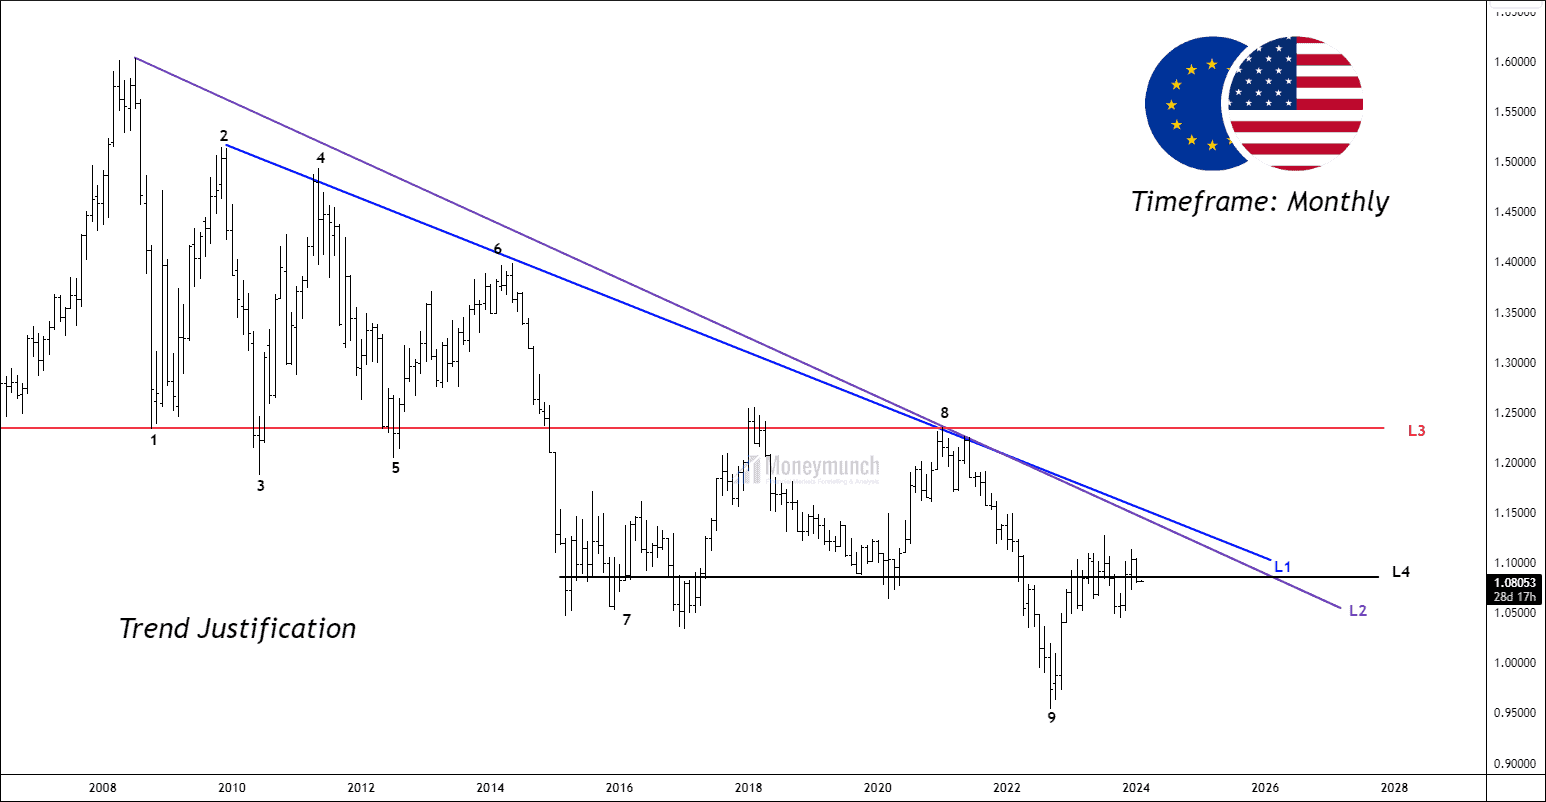
It is the EURUSD monthly timeframe, and it shows a downtrend for more than 15 years. The price has settled in a downward value area.

Elements of price action Breakdown:

  1. Excess:
    There are nine price excesses, four on the upper band and five on the lower band. It shows that the sellers were too aggressive when the price touched the upper band of the channel in comparison with the lower band at buyers. Buyers/Bulls tries makes the initiative to breakout the structure but end up when another party finds the price convenient for them. 
  2. Control line:
    The control line represents the gravitational force to the price. The price can’t stay away until it breaks the range. There are twelve touches on the control line, and few are mentioned on the chart.
  3. No Trading Activity Zone:
    No trading activity is the zone where one party, either bull or bear, takes control and outnumbers the other. There are a total of 14 no-trading activities zone. Both of the participants have seen each other.
  4. Sub-value area:
    A rectangle sub-value area has taken place from March 2015 till now. An excess became a great place to buy the move, yet the upper band of the sub-value area provides strong resistance. The control line of this value area at 1.1480 is sharp enough to act as a pivot level. It could be a resistance to the current price.
Free fx eurusd chart callsContinue reading

NASDAQ AMAZON – Wave Strength Analysis On Daily Chart

Free nse amazon chart calls

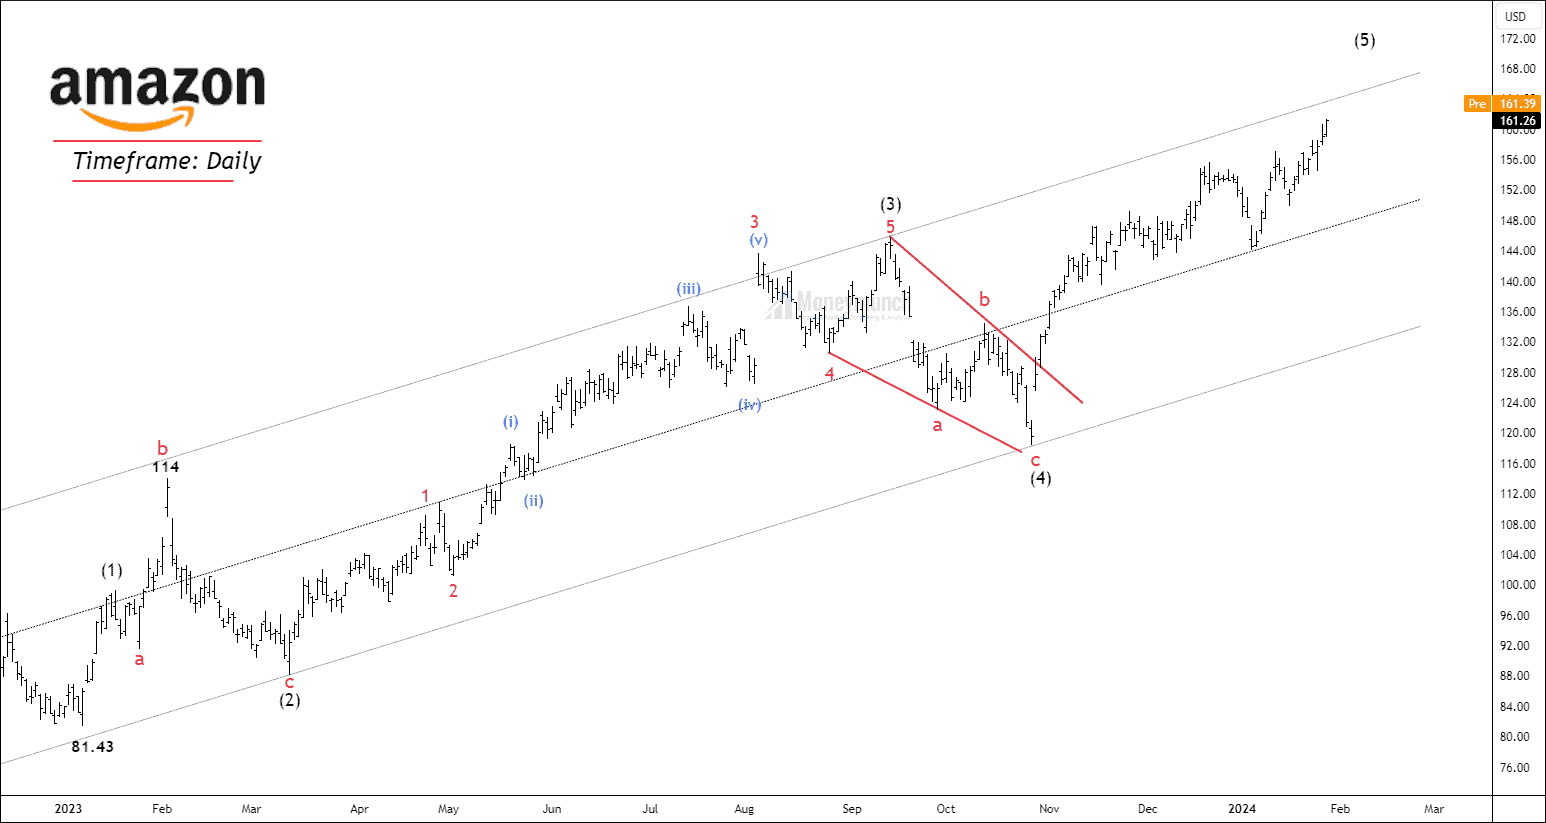
NASDAQ AMZN has started an impulsive cycle from 81.33, and the price is forming the final wave (5). The price has accomplished a corrective wave (4) and formed sub-waves of the impulsive wave (5).

Wave Formation & Fibonacci relationships:

Wave (2):

  • Wave 2 has formed an expanded flat with a 3-3-5 structure.
  • Price retraced 78.6% of wave (1).

Wave (3):

  • Wave 3 has constructed a motive structure.
  • Wave 3 is an extensive wave with a 3.618 multiple of wave (1).
  • The sub-structure and element structure is visible.

Wave (4)

  • Wave 4 is a zigzag formation and can be mentioned as a triangle by changing the labels.
  • Wave (4) retraced 50% of wave (3).

Wave (5)

  • The structure of wave (5) does not look like an ending diagonal. So, the last option for us is to assume it is an impulse.
  • The common Fibonacci relationships are:
    – Wave 5 = Wave 1
    – Wave 5 = 0.618 reverse Fibonacci of wave 4
    – Wave 5 = 0.618 X Waves 1 through 3
    – The upper band of the parallel channel and throw-out out in many cases.

ADX (average directional index):
The ADX (14-day setting) shows strength coming but doesn’t advocate the cause of the shart surge. Traders must note to take high probability traders after ADX crosses 30. It only measures whatever trend it is, should one trade or not, by measuring the strength of the trend.

ADX level of 22 shows that the market can be choppy in many instances.

Weekly Trend:

The weekly trend looks strong, as the price has broken out a crucial resistance zone at 143. If the weekly trend & Daily trend are bullish, day traders can take long traders to be within the trend.

To look in-depth, we have to analyze the shorter timeframe. This way, we can get a clear story of wave (5) before initiating any position.Continue reading