
MCX CRUDE OIL – Gann & Fibonacci Reveal Next Moves

MCX Silver: The Path to 1,11,000 or a Dip to 80,000?

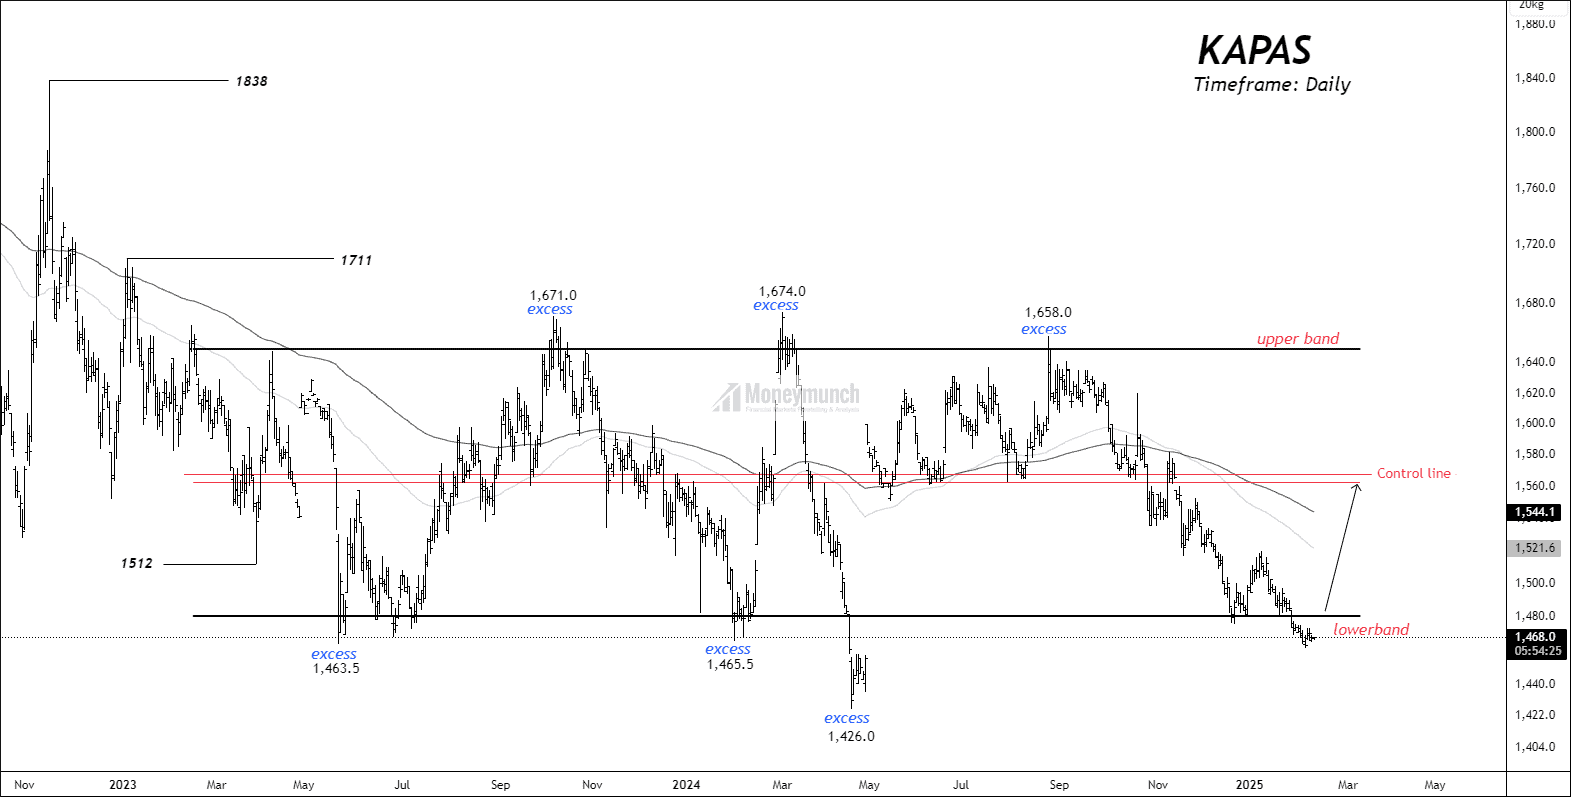
NCDEX KAPAS – Price Action Breakdown
Trade Setup: MCX LEAD, ZINC & NICKEL
 Unlock This Article
Only subscribers can read the full article. Please login to read the entire article.
Is MCX Gold’s Bullish Trend Here to Stay?
Did you trade MCX Gold Price action setup?
Visit here: MCX Gold: Elliott Wave Insights on Ascending Channel
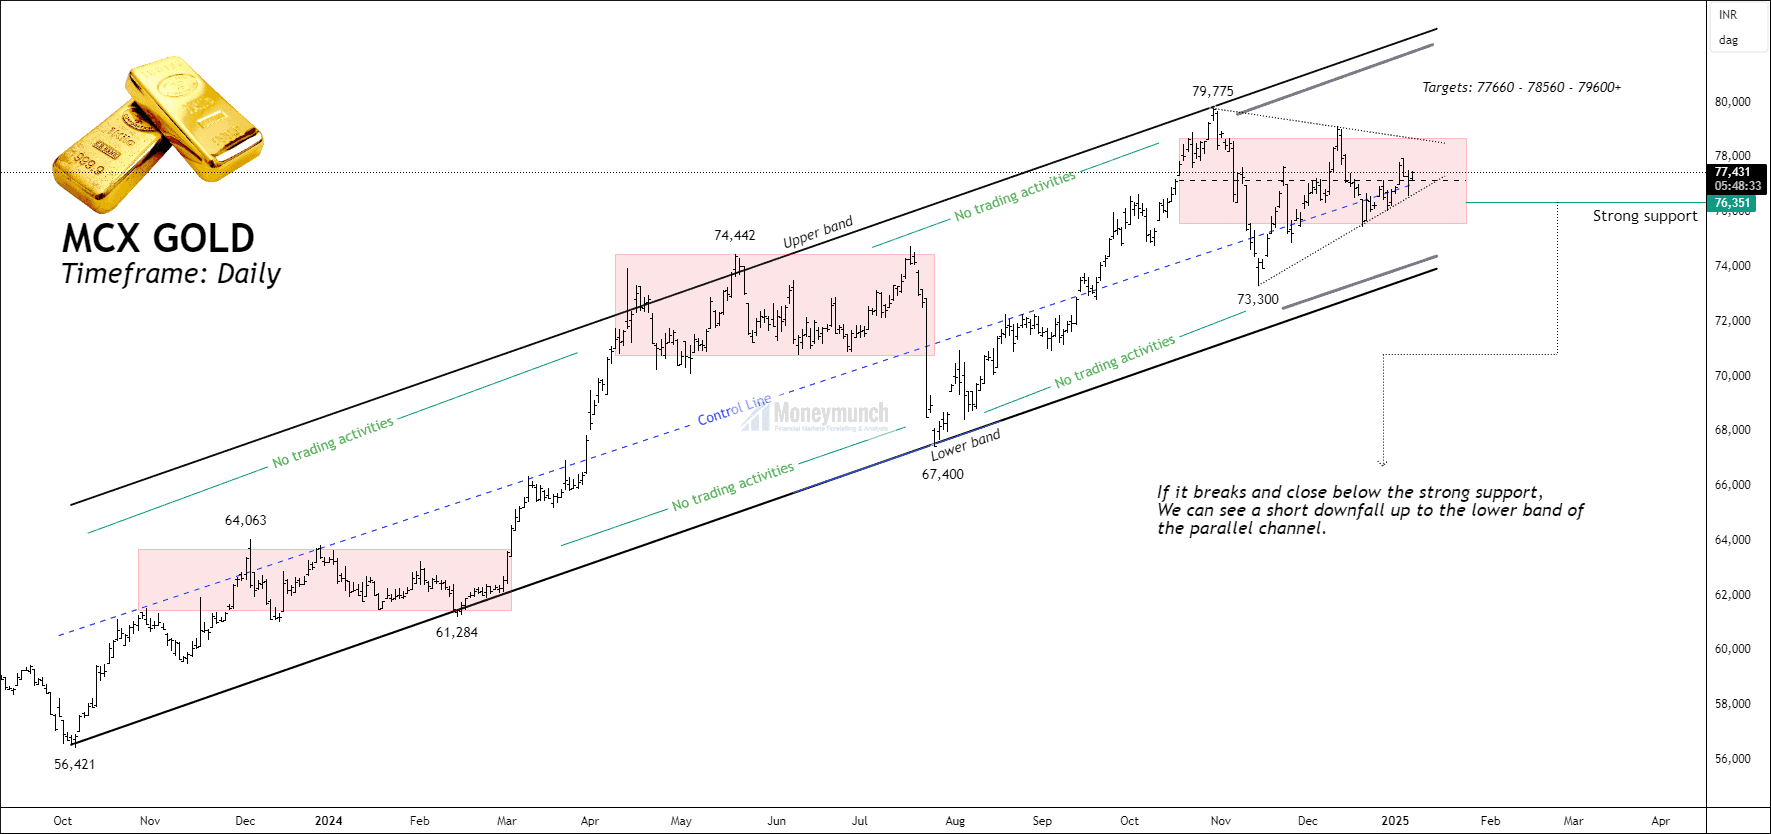 BEFORE
We had written in the clear words, “If the price closes above the control line, it could potentially reach the following targets: 77660 – 78560 – 79600+.”
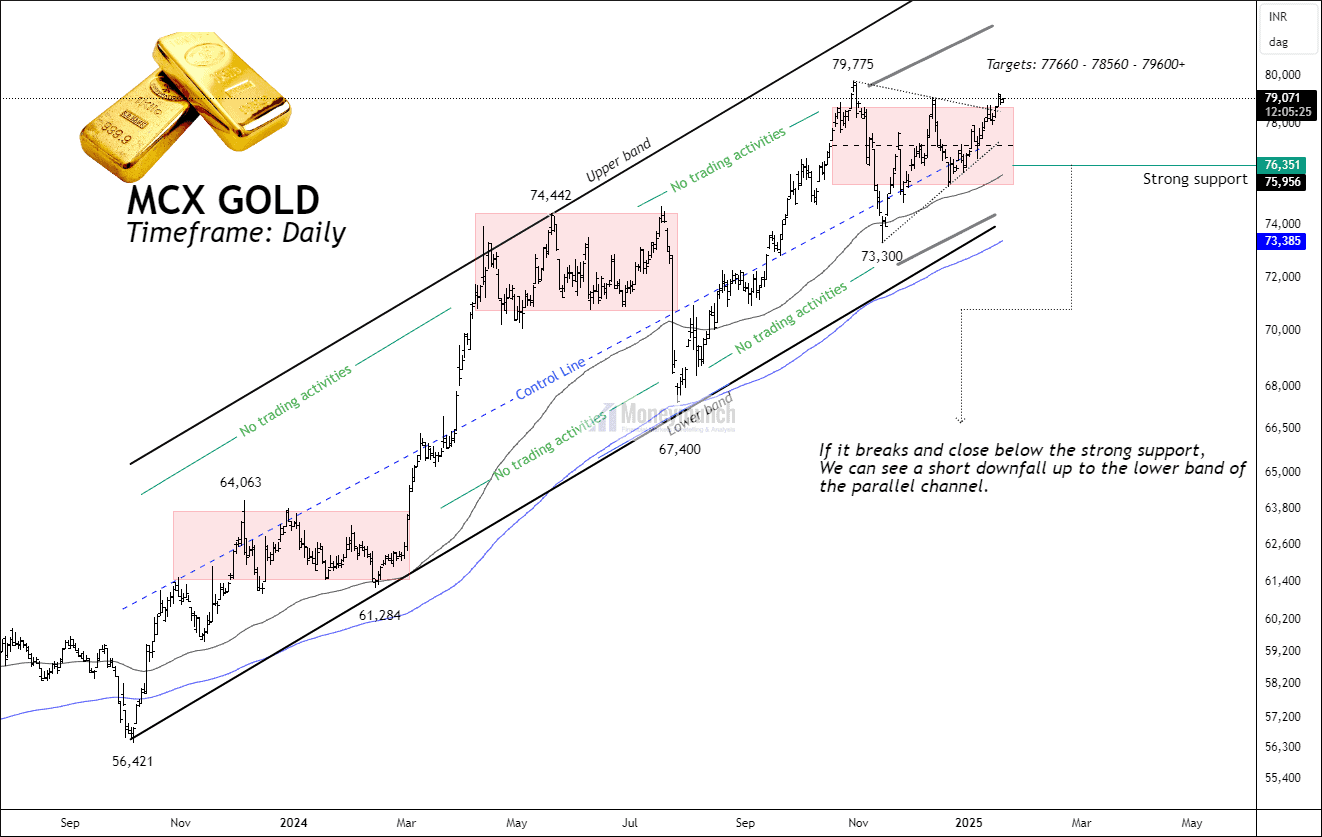 AFTER Continue reading