Research Report – COPPER, CRUDEOIL & ALUMINIUM
Research Report – MCX ALUMINIUM, GOLD, NATURALGAS
Will NSE COPPER Reach the Final Target?
Did you trade MCX Copper Wave Setup?
Click here: Long-Term View: IS MCX Copper Preparing For A Take-Off?
 BEFORE
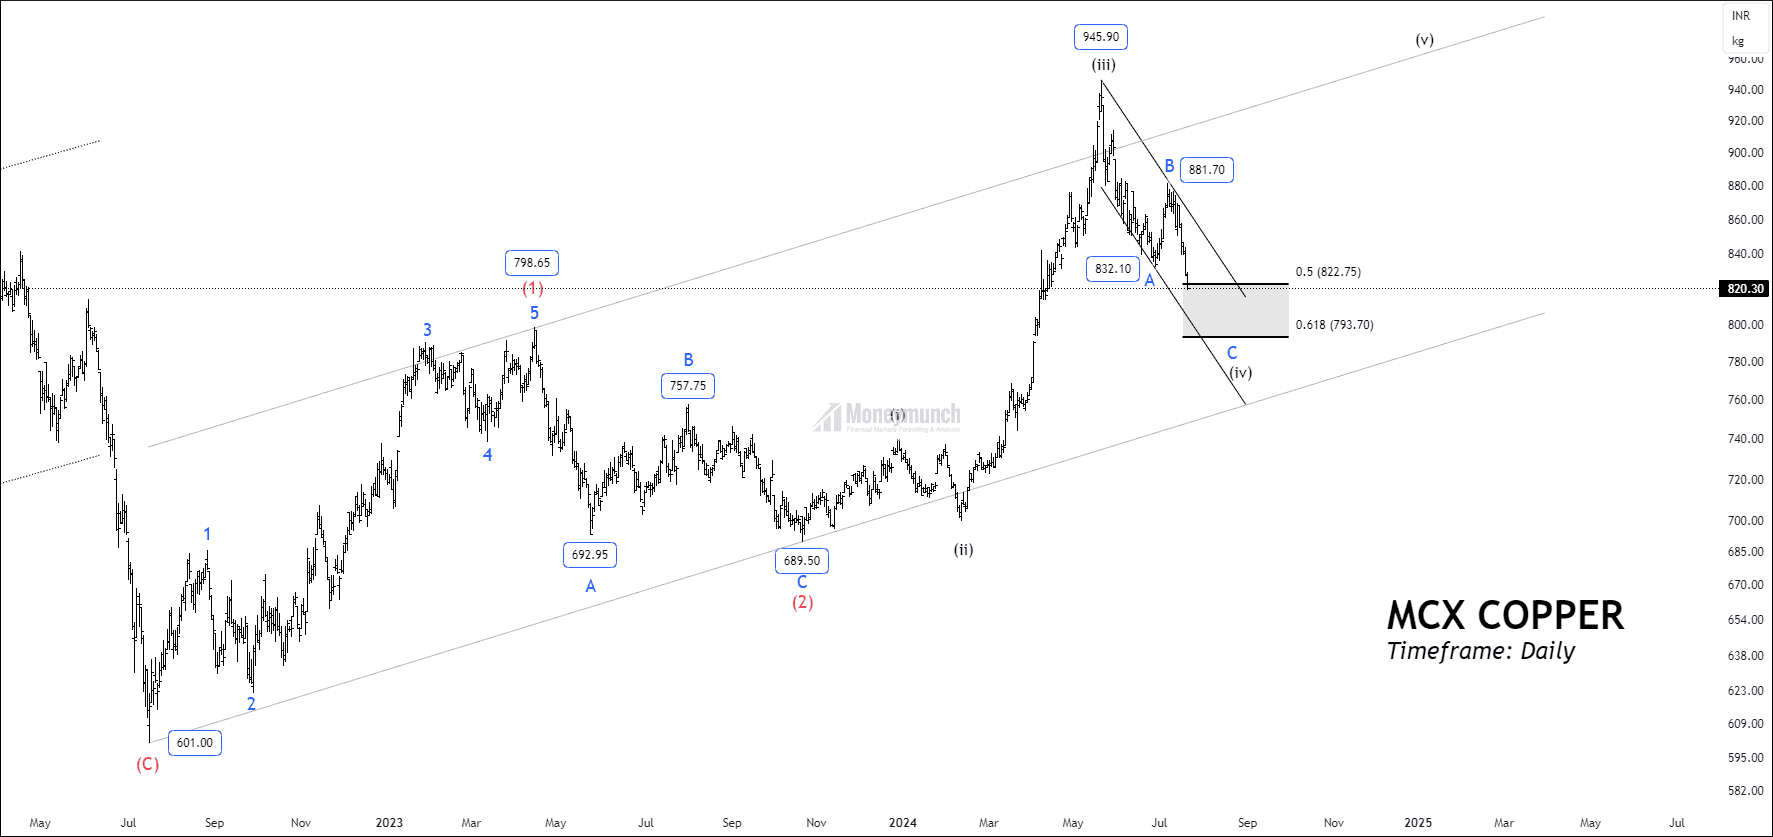
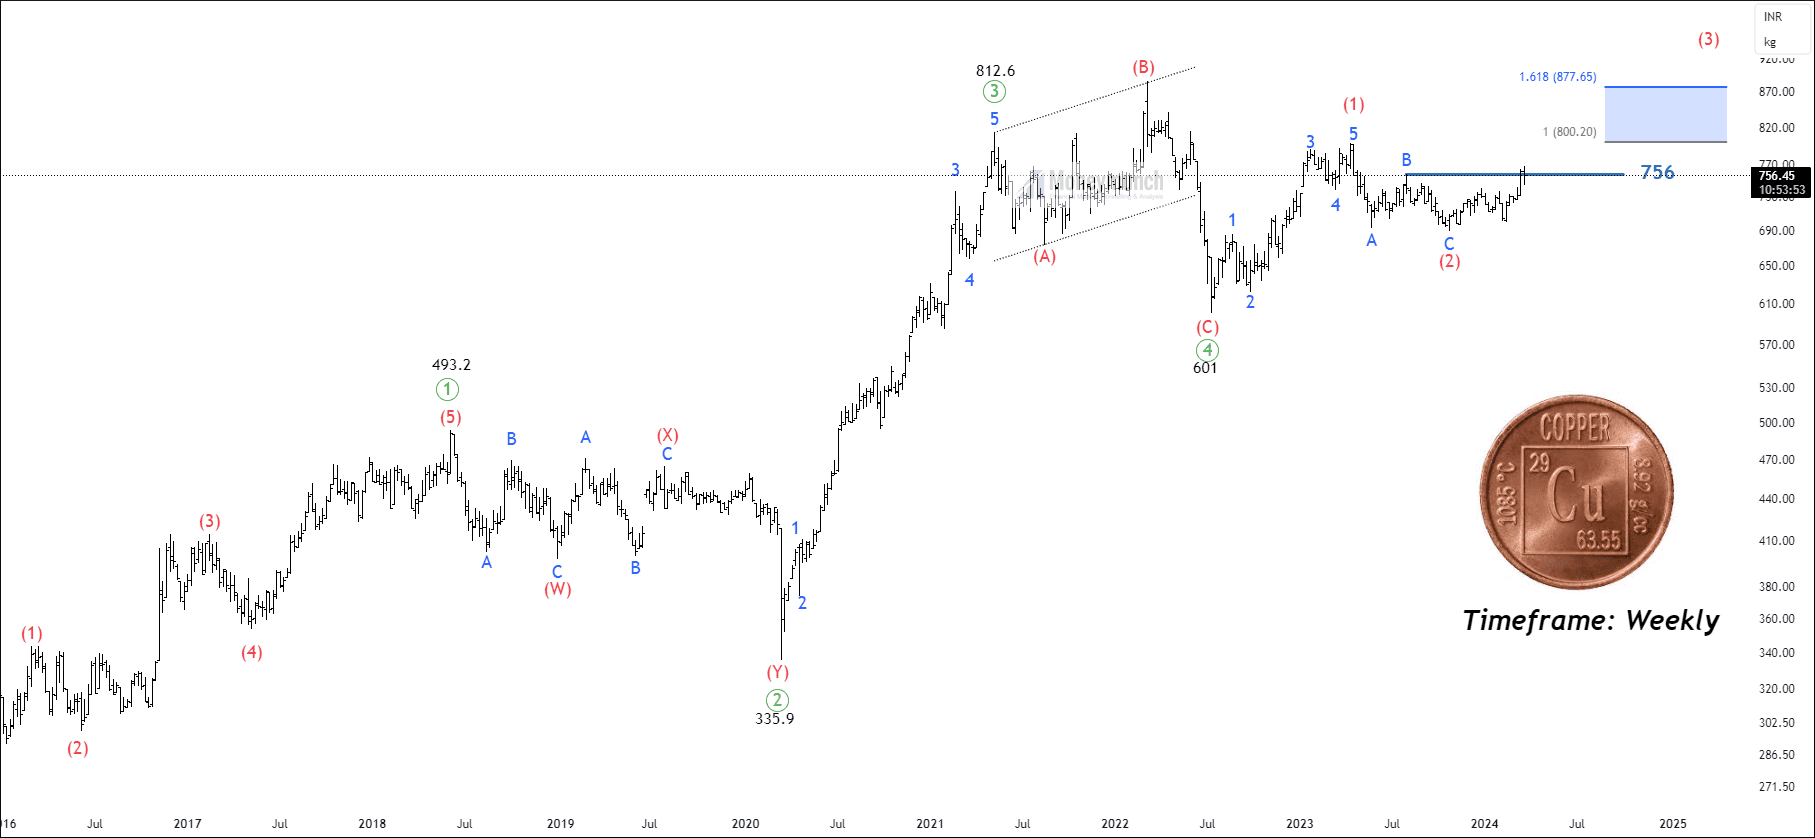
Sub-wave c of wave (2) of wave ((4)) occurred at 689.5. If the price breaks out wave B at 756, traders can trade for the following targets: 800 – 840 – 877+.
 AFTER
AFTER
MCX Copper – Trading Insights & Updates
Did you trade MCX Copper Wave Setup?
Click here: Long-Term View: IS MCX Copper Preparing For A Take-Off?
BEFORE
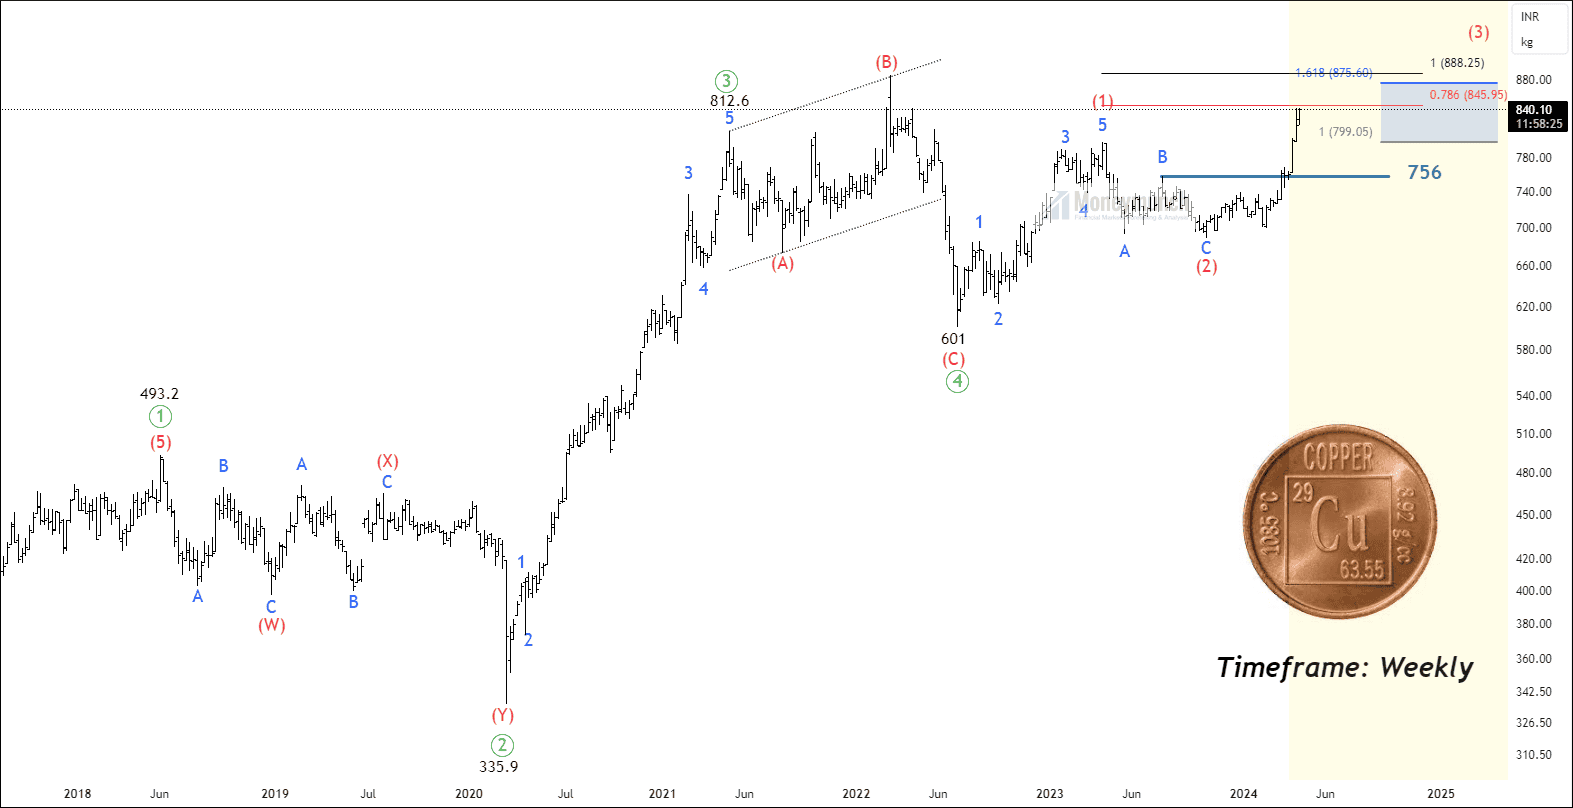
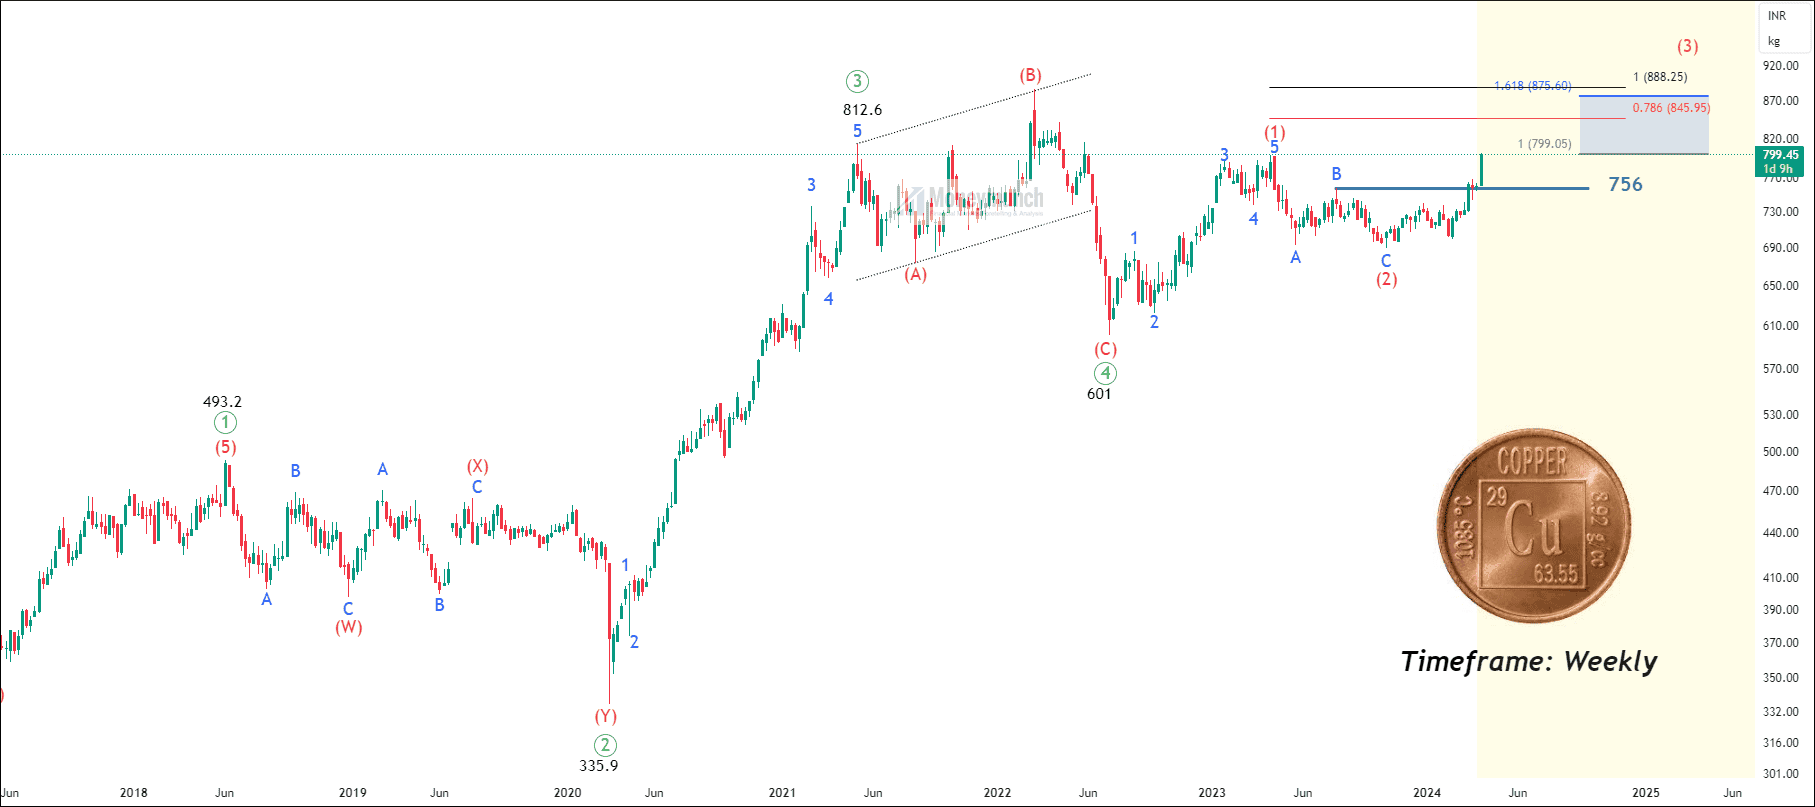
Sub-wave c of wave (2) of wave ((4)) occurred at 689.5. If the price breaks out wave B at 756, traders can trade for the following targets: 800 – 840 – 877+.
 AFTER
AFTER