EWT – Identifying Bullish Trends in MCX Aluminium
MCX COPPER – Trading Insights & Updates
Have you Traded our wave analysis on MCX COPPER?
Visit here: MCX Copper: Trend Forecasting Using Elliott Wave analysis
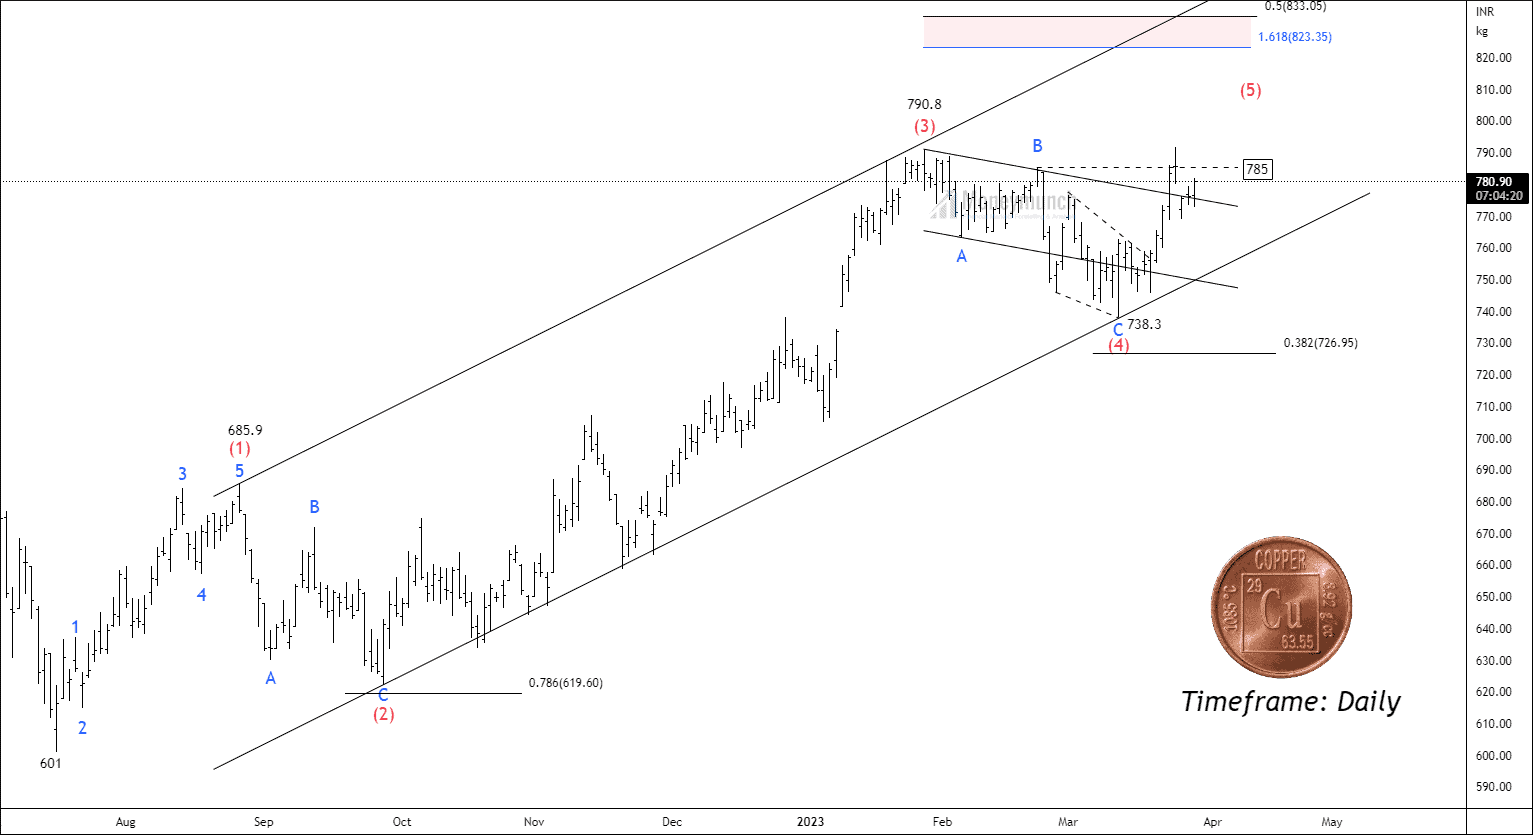 BEFORE
We have written clearly,”If the price remains above the B wave at 785, traders can consider trading towards the targets of 791- 809 – 821+.“
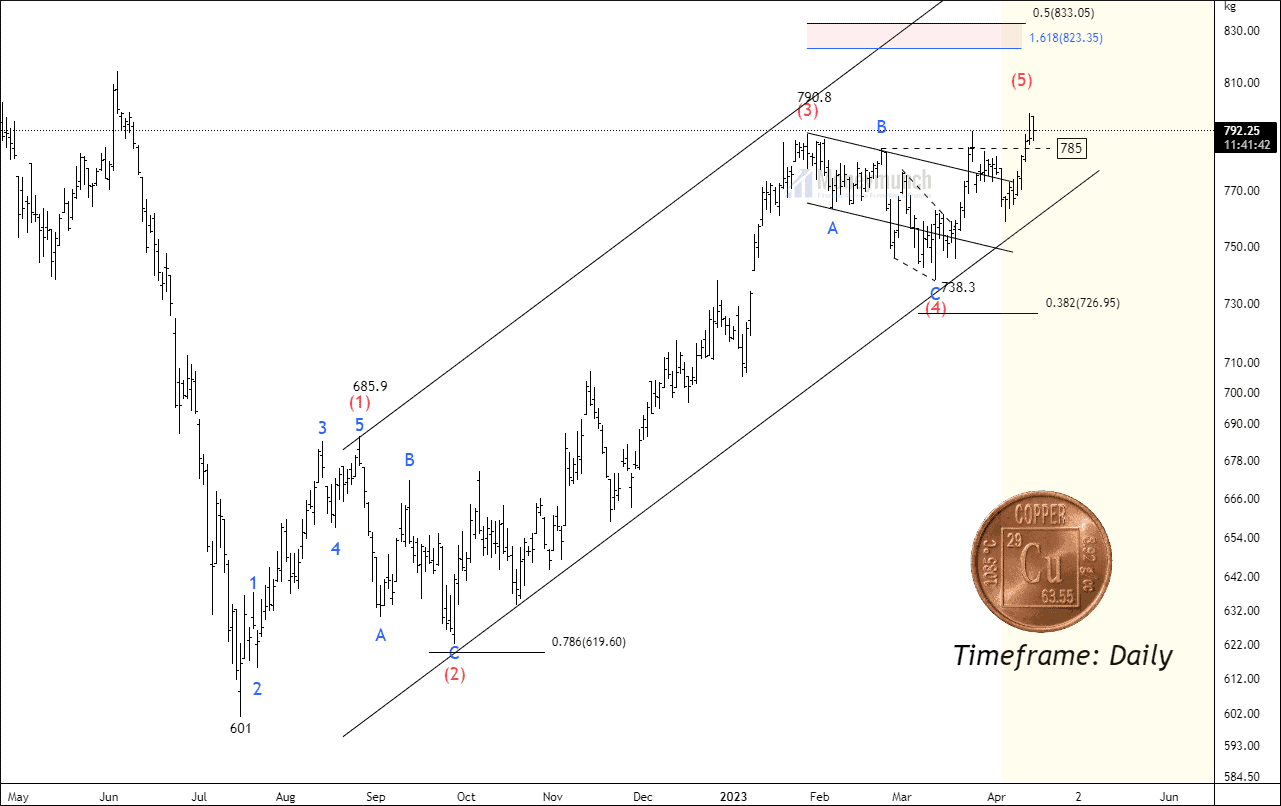 AFTER
AFTER
MCX Copper: Trend Forecasting Using Elliott Wave analysis
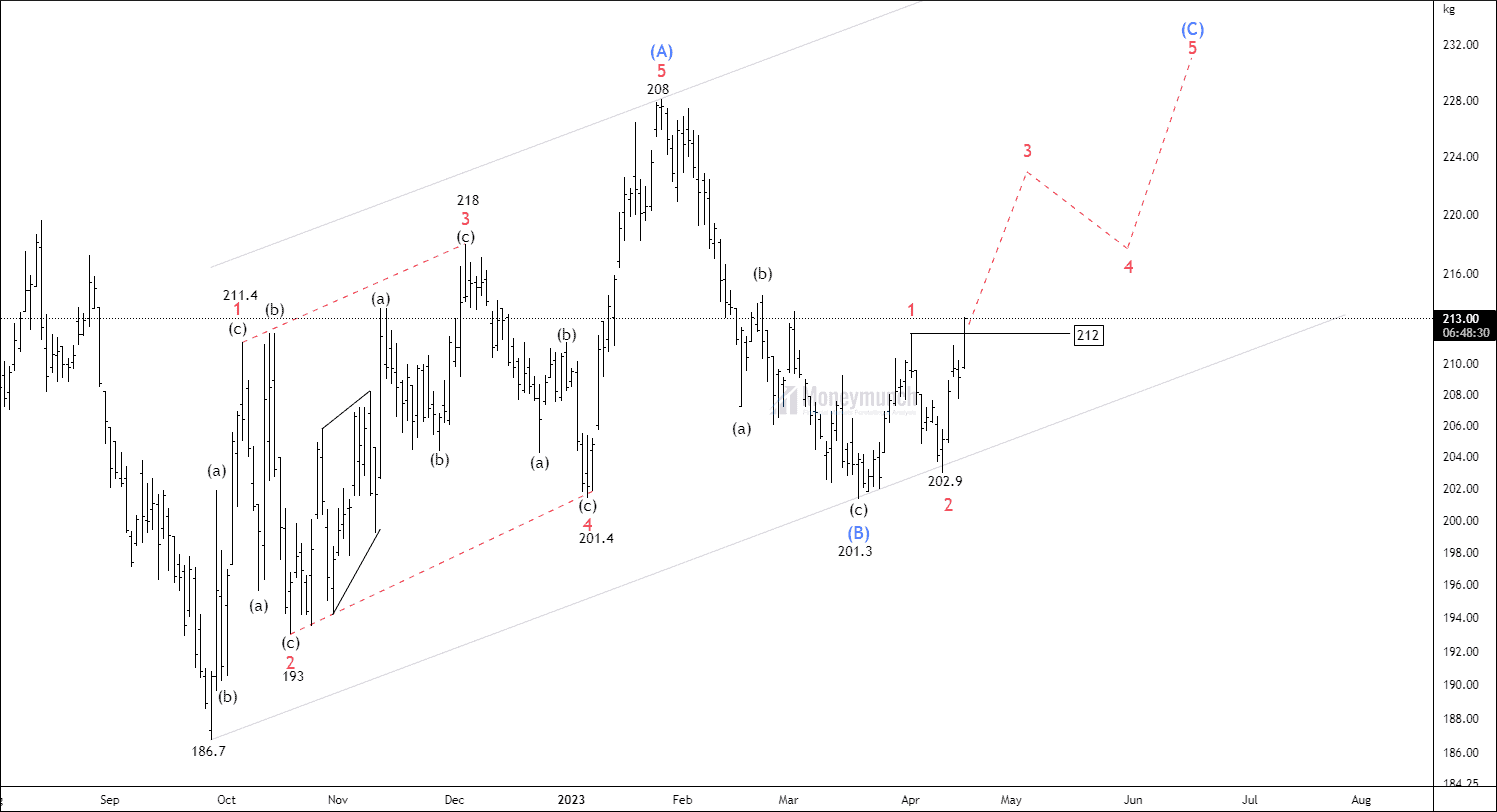
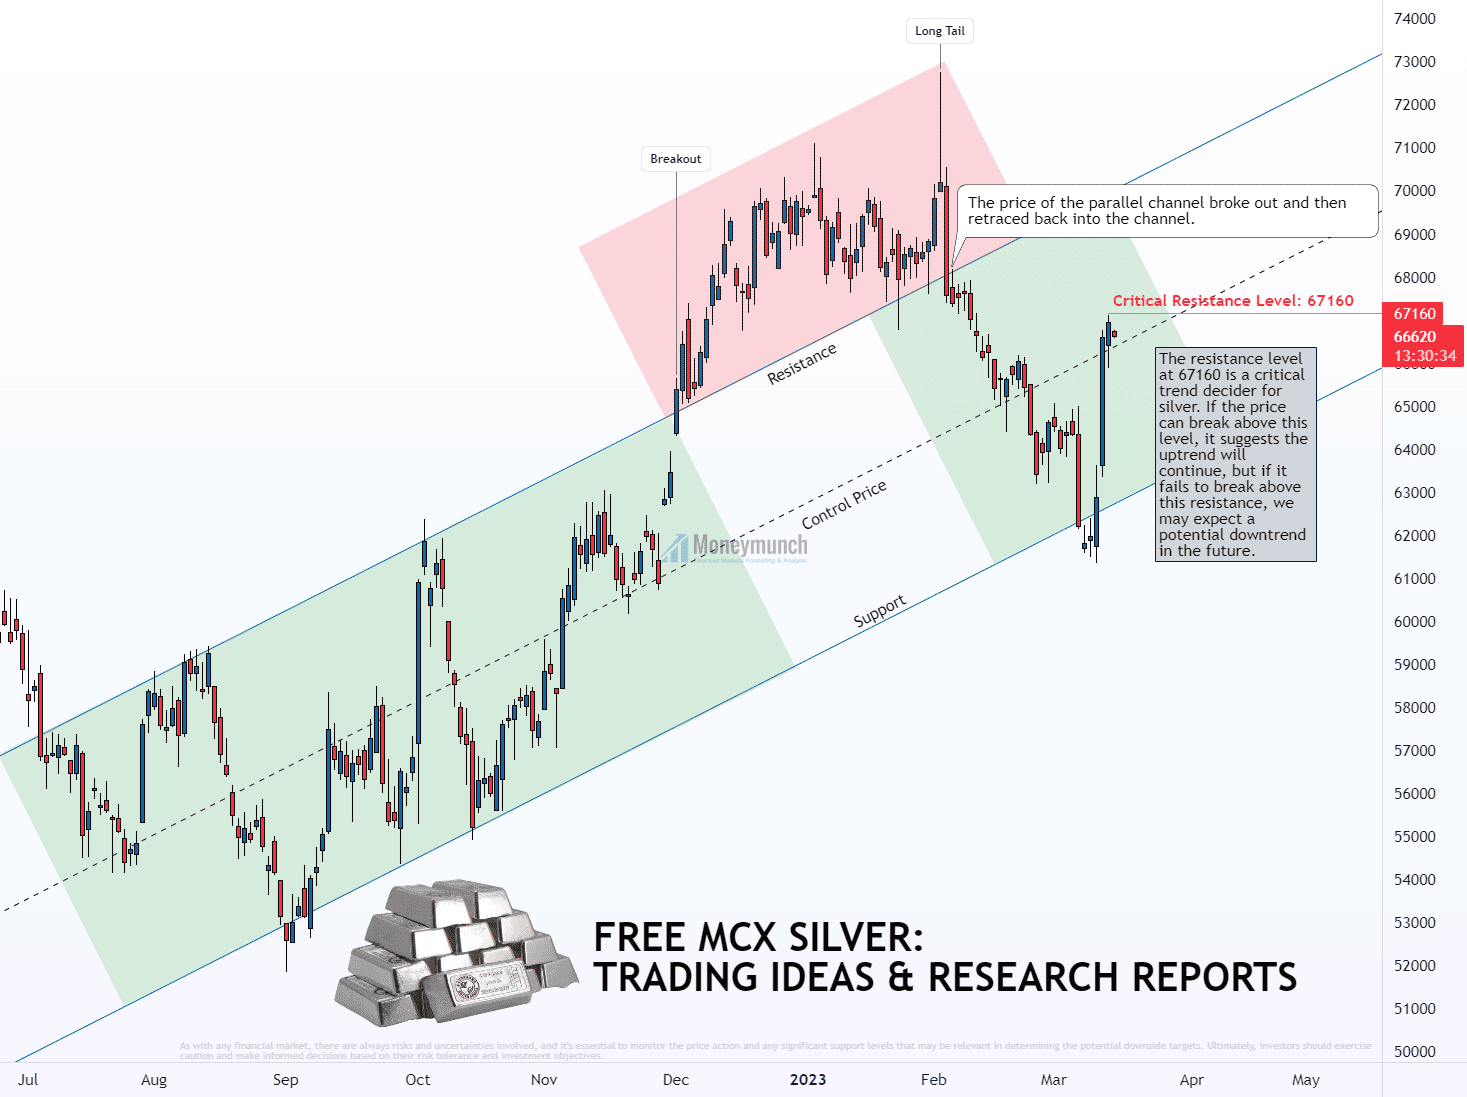
Silver Price Analysis: Critical Resistance Level and Potential Upside/Downside Targets
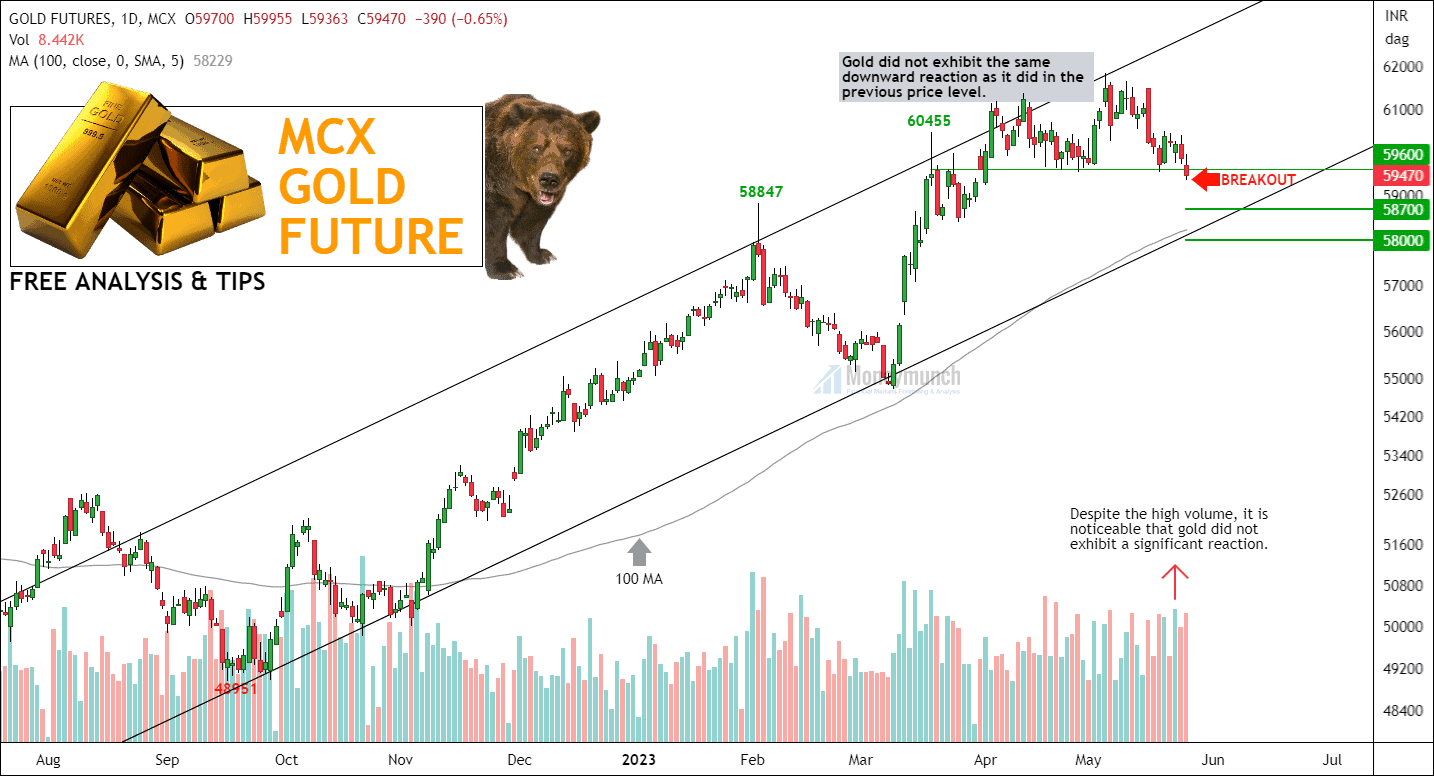
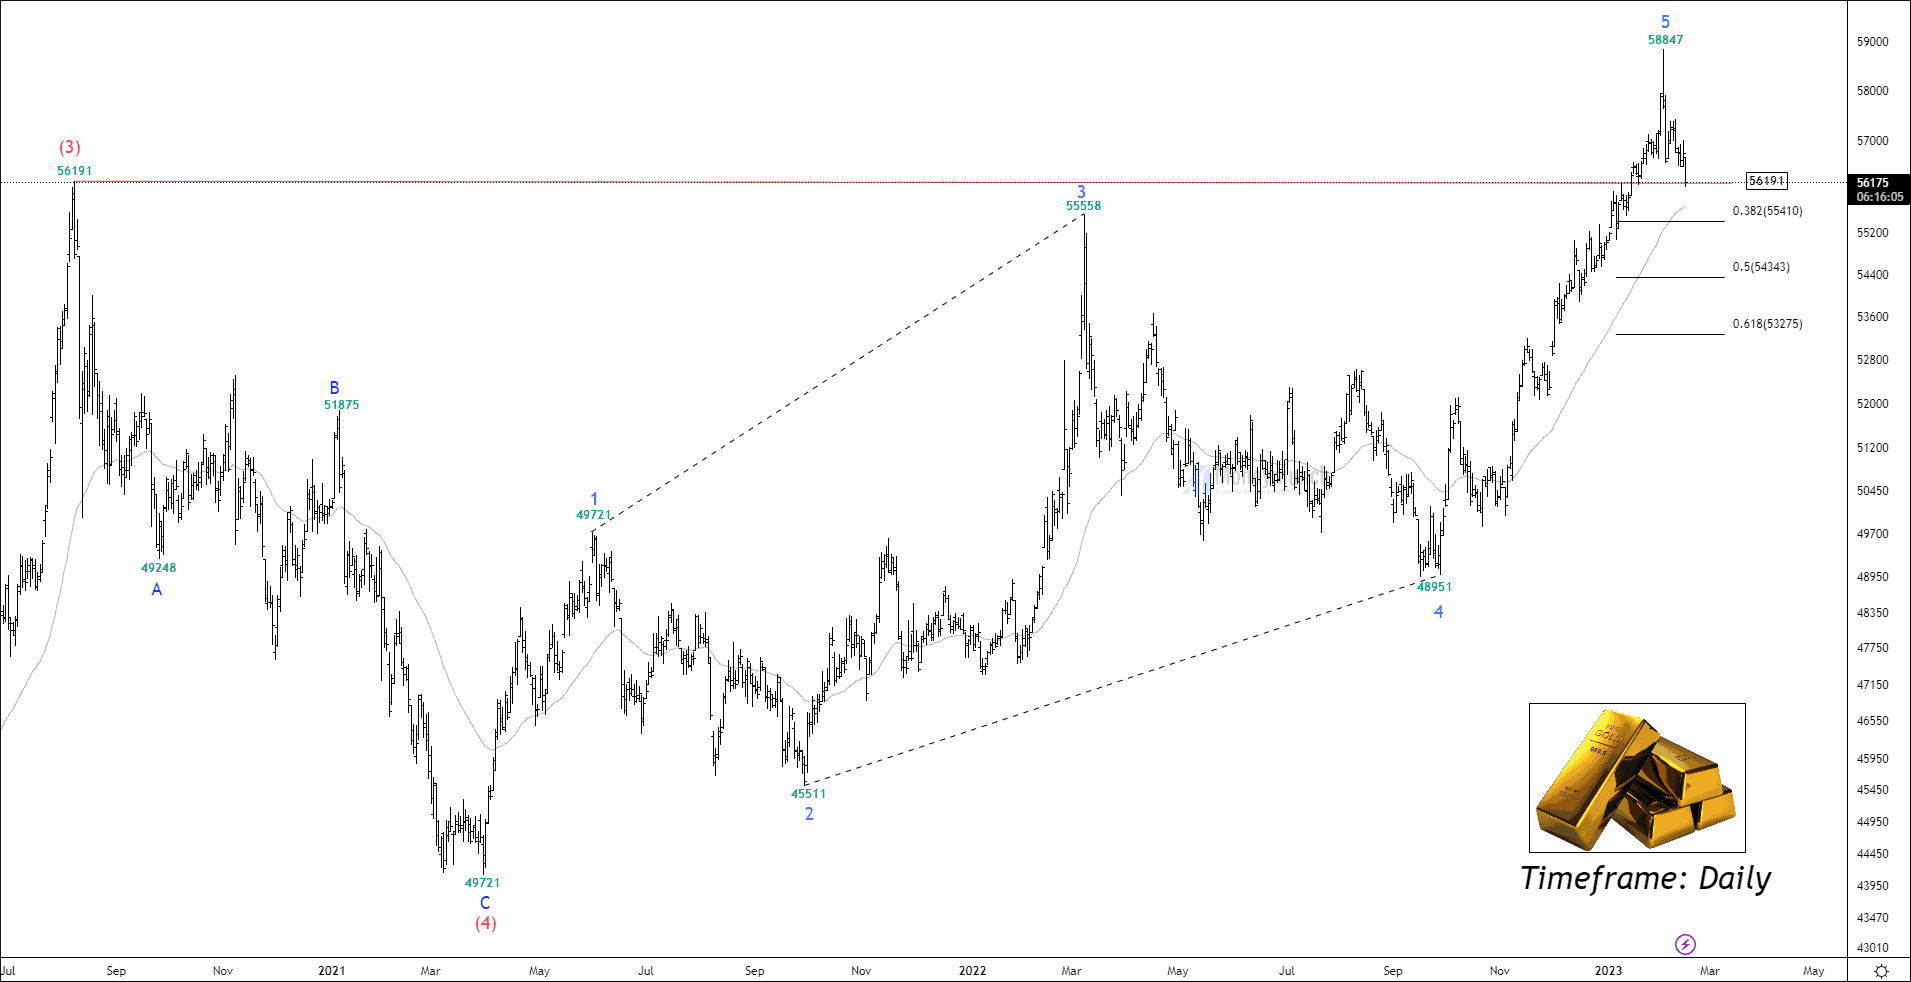
MCX GOLD – Tips & Updates
Have you traded MCX Gold Wave Setup?
Visit here: EWT – Is MCX Gold Preparing For A Steep Correction?
 BEFORE
I have written clearly, “If the price breaks down low of wave (3), traders can sell for the following support: 55410 – 54343 – 53400.”
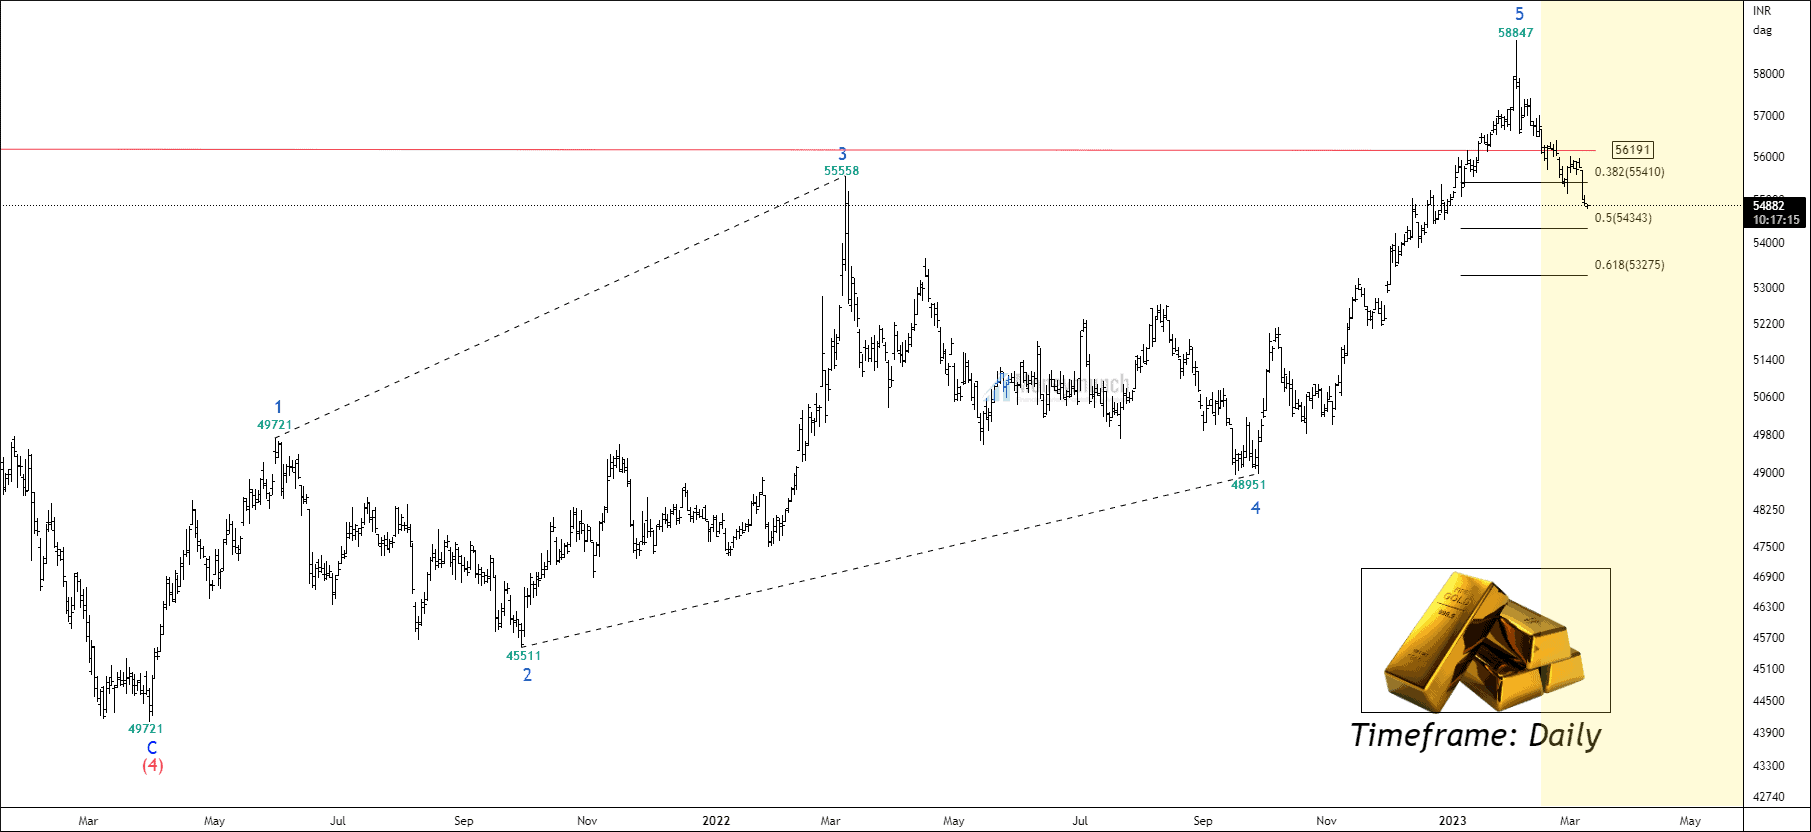 AFTER
AFTER