Bearish signals remain for crude oil price
Timeframe: Daily
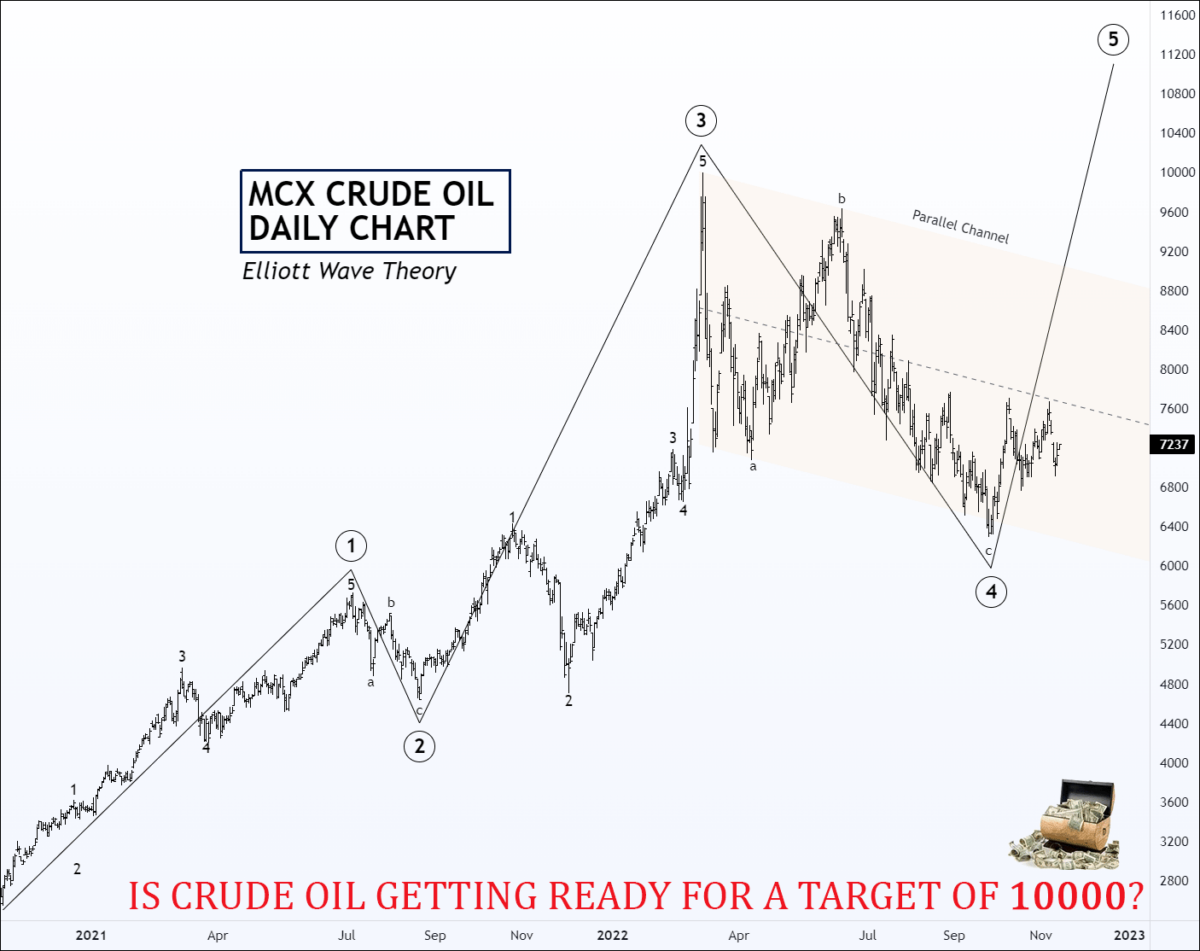
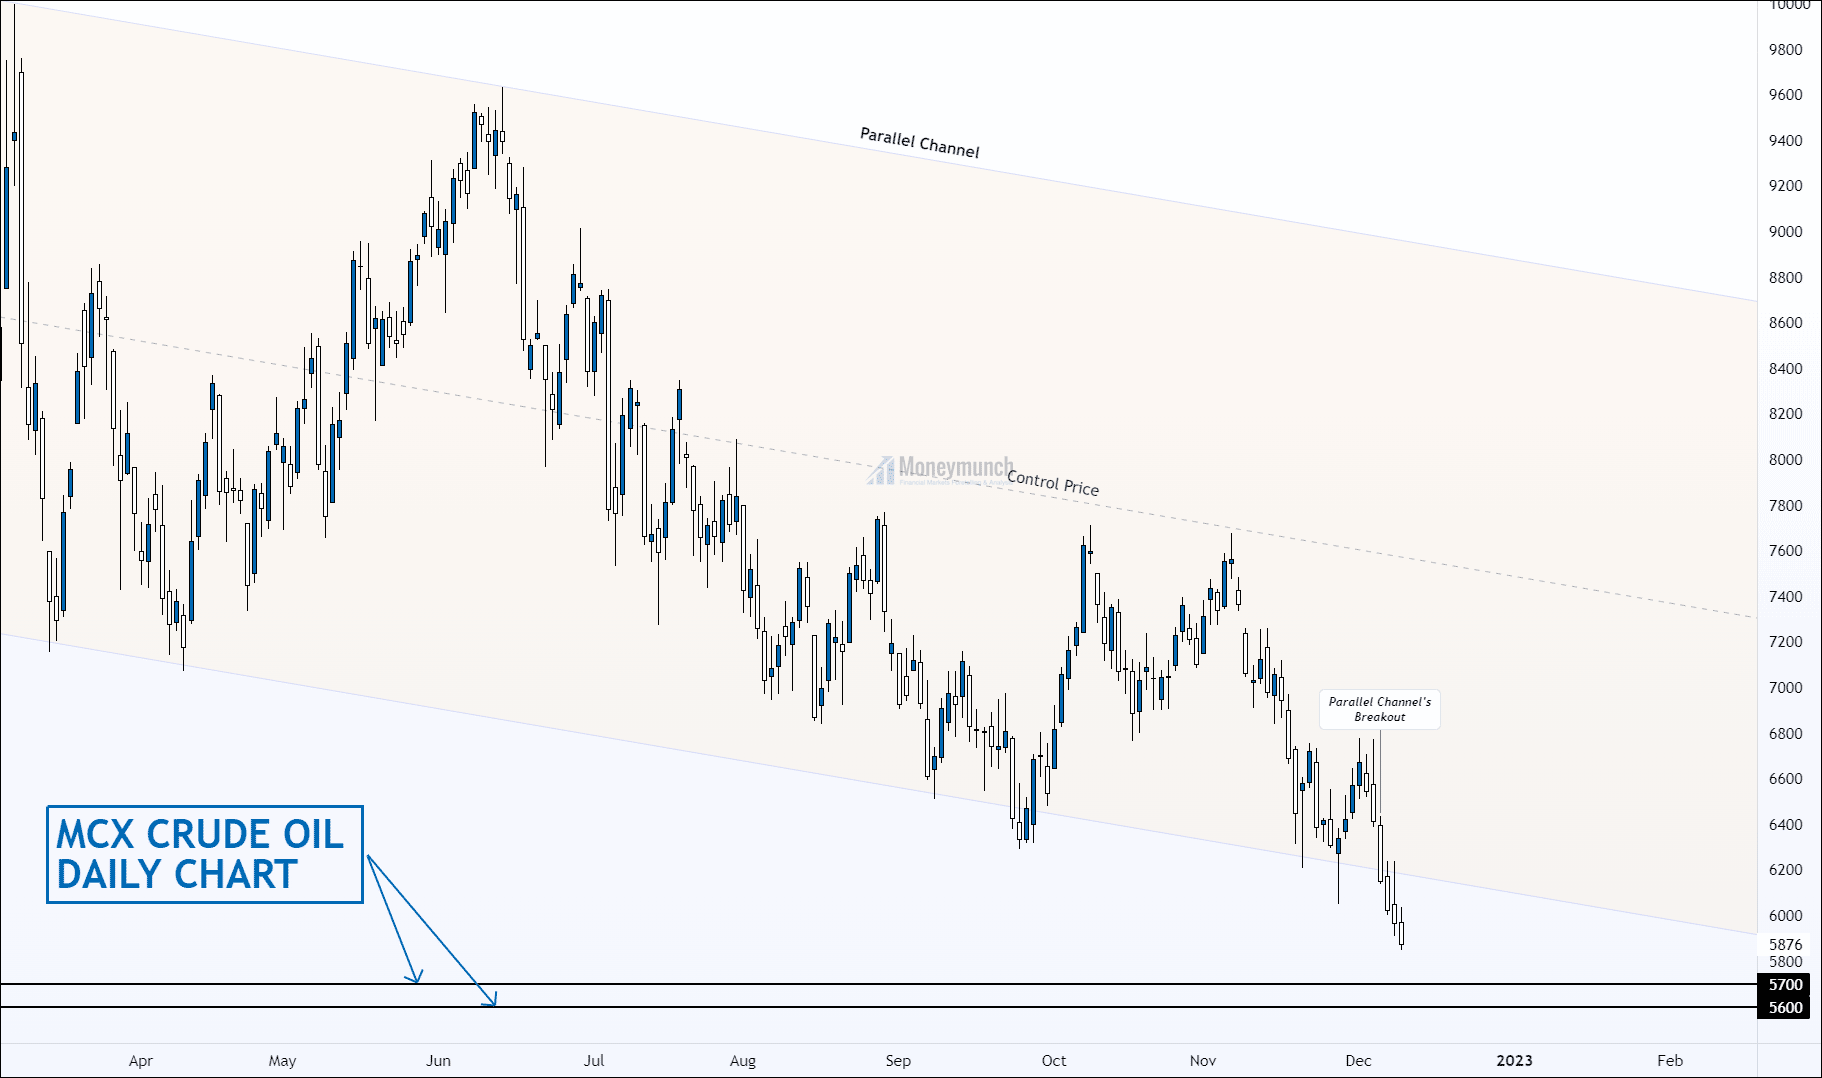
After making a high of 9996, the price started forming a descending channel. The channel has been occurring for more than 39 weeks. 7735 was a crucial resistance level where the price tried to test for three attempts but failed to maintain bullish momentum.
The price has broken down the descending parallel channel and closed below the recent lower low to create a new low. Bearish momentum can lead price to the following targets: 5700 – 5600.
Trade will be invalid if the price sustains above the upper band of the descending parallel channel.
Subscribers will have excess to further information soon. (To become a subscriber, subscribe to our free newsletter services. Our service is free for all.)
Will Gold survive above the 55000 level?
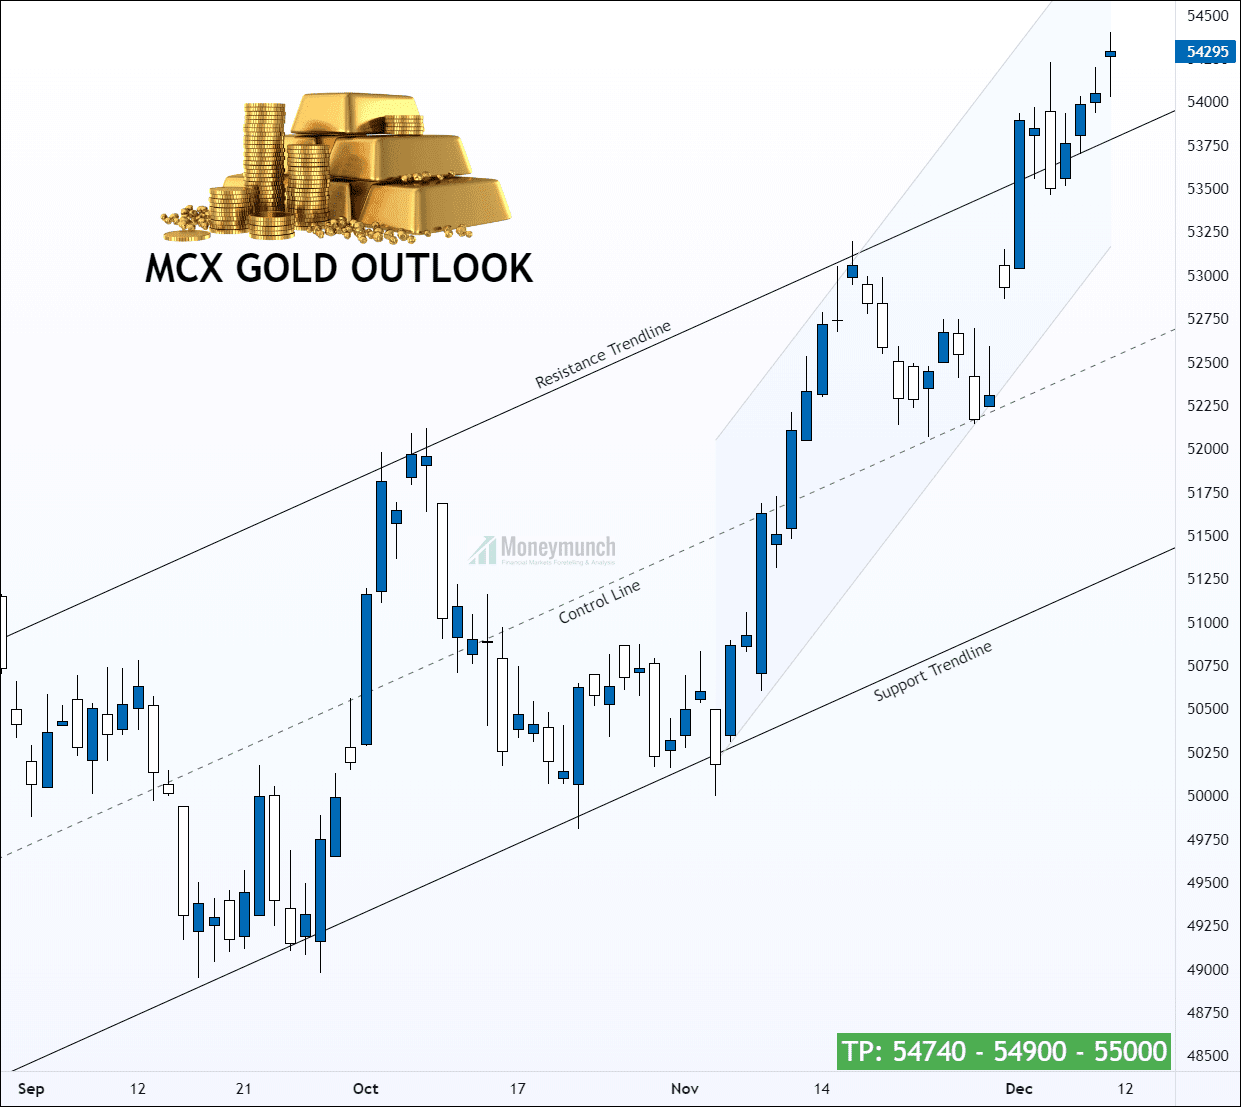
Timeframe: Daily
MCX GOLD has broken out of the 10-week-old upper resistance band of the parallel channel and moving forward to the crucial resistance of 55000.
After breaking the swing high of 53663, the price faced resistance until demand pressure turned the level into support. Currently, gold is showing a bullish sentiment, which may lead to the following targets: 54740 – 54900 – 55000+.
Note: the resistance line is currently providing support after the breakdown, but closing into the channel will increase selling pressure.
We will update further information soon.
Get free MCX ideas, chart setups, and analysis for the upcoming session: Commodity Tips →
Have you any questions/feedback about this article? Please leave your queries in the comment box for answers.