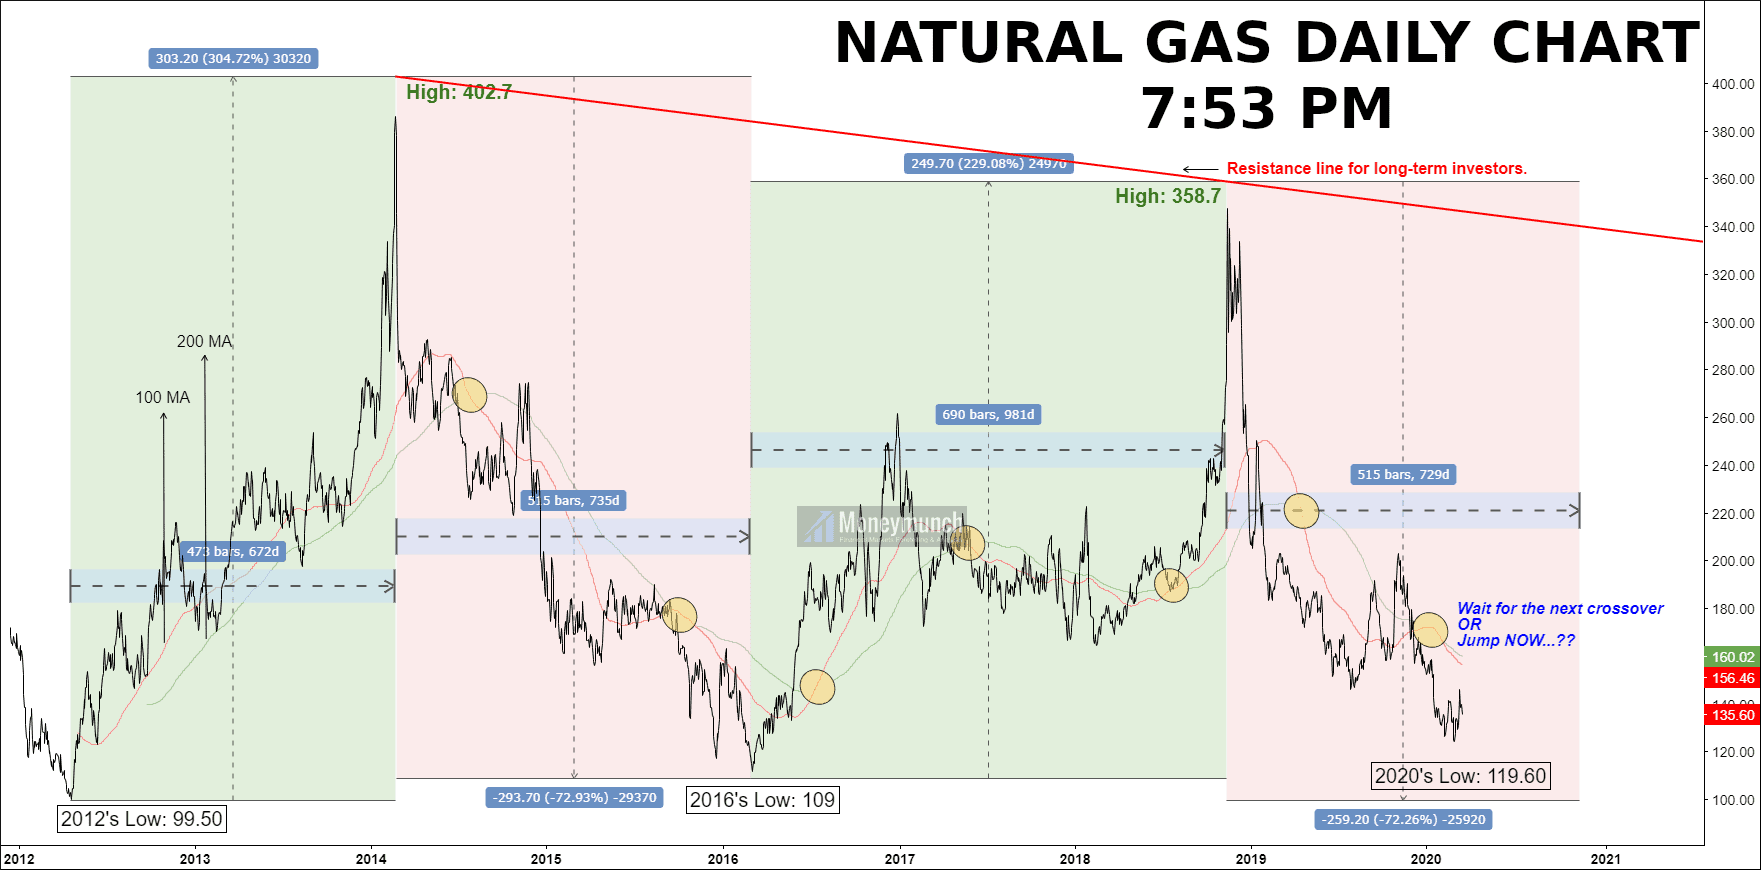
MCX Tips: Natural Gas Give Traders Another Opportunity

free natural gas chart tips

Since the market opening bell, natural gas sharply moving up as per the above chart [5:20PM]. Do you think it will keep upward rally?

To become a subscriber, subscribe to our free newsletter services. Our service is free for all. you can apply the following trading strategy to earn a profit.

Use these support & resistance as targets:

Long positions above lower trendline with targets at 160.60 – 164 – 165+ in extension.

Below this lower trendline looks for further downside with 159.80 – 158.40 – 157 as targets.

Entry-level + Stop loss + Targets = For subscribers only!

Continue reading

Tips & Charts: Gold, Silver, & Crude oil Special Report

free gold chart tips

MCX Gold at Support: the Upcoming Move

The last weekend moves had down. When the gold brake below the box, the bears can win this battle.
Output: 36800 – 36000 – 35360 levels (Beware of fake out)

If the gold breaks the box upside in the future, then these areas will be support areas that can keep the gold from falling. And the result will come out with the following levels: 39000 – 39600 – 40000+

For Intraday Traders:

gold intraday chart calls

Silver Price Setting Up For A Downside Price Rotation?

free silver calls chart
free crude oil chart calls

What If Crude Oil Is NOT In A New Bull Market?

Support trend line breakout is a clear sign for STOP BUYING. Crude oil selling will start right after redline. I will tell you in the next update what happens if it breaks that line.

Keep buying at/above the support trend line for 4280 – 4356 – 4400 levels.

Remember, this strategy works for intraday and short-term investors only. To become a subscriber, subscribe to our free newsletter services. Our service is free for all.

Continue reading

Counter-trend Rally: MCX Gold, Silver, Crude oil & Jeera

free gold calls chart

Gold & Silver: Decision Time

Gold prices stuck in the range of 37500 – 38600 levels. What will happen next? The full Gold report will be updated soon for the subscribers only. To become a subscriber, subscribe to our free newsletter services. Our service is free for all.

Silver’s traders can read our last report. It’s very close to our levels: MCX Silver Intraday Trend Analysis & Tips

free crude oil tips chart

Crude oil Golden Long-Term Opportunity

As per the chart, the resistance trendline is crucial here. You can take the 4140 levels as a trend changer. Above resistance trendline, looks for further upside with 4240 – 4360 – 4440+.

But in the week beginning, 4100 – 4060 expected levels.

ncdex jeera calls & charts

Jeera – What Next?

Jeera’s next support level is 15700 level. After the breakout of support, we can expect 15500 – 15300 levels as targets.
Above 16340 (or upper trendline breakout) looks for further upside with 16600 – 16900 – 17160+ as targets.

Continue reading

MCX Crude Oil Dec: Intraday Trading Calls With 15-Min Chart

free crude oil tips charts

Hurdle: 4060

Upward Targets: 4146 – 4200+
Downward Targets: 4030 – 4000

This chart is enough to understand the crude oil trend. Further details (including accurate entry-level, targets, and stop loss) will update soon for the subscribers only.

To become a subscriber, subscribe to our free newsletter services. Our service is free for all.

Continue reading

MCX Tips: Best time for Gold, Crude oil & Natural gas

free gold tips chart

Gold Traders for Final Opportunity

Here’s a clear indication of Gold for a new trend. All-new opening gap hiking the gold price. Keep your eyes on Lower Trendline and jump on it.

On September 15, 2019 report, we have already updated the new target (38500 – 39000 – 39500 – 40000): MCX Gold Technical analysis, forecast, & tips for the current trend

That’s all about the uptrend. What will happen if gold will break out the lower trendline?

Wait for two consecutive closing price of gold below to lower trendline. It will confirm the fake-out. And then move on for 36600 – 36000 – 35500 levels.

crude oil tips chart

Crude oil Bottom Rotation Sets Up New Opportunities

Silence zone area: 3740 to 3460
Only intraday trading recommended here.

Two or three consecutively closing prices required to come out from the silence zone. Beware of fake-out.

Upward targets: 3900 – 4000 – 4100
Downward targets: 3300 – 3200 – 3100

free natural gas tips

Are You Ready for the Next Big Move in Natural gas?

This is natural gas chart is itself an answer to an upcoming trend.
A simple trading strategy:

  • First, ensure the fake-out.
  • Buy for 190 – 200+ levels OR Sell for 150 – 140 – 130 levels.

These charts are for advanced users only. Remember, only members get accurate entry-level, stop loss and targets on the market hours.

To become a subscriber, subscribe to our free newsletter services. Our service is free for all.

Continue reading

Crude oil Sets Up Two New Trades – Here They Are

Before we discuss these incredible trade setups in the crude oil, we’re receiving the couple of emails for gold trend. Here’s the answer: This week we don’t need to update about the gold. We have already explained in the previous newsletter: MCX Gold Technical analysis, forecast, & tips for the current trend

free crude oil tips charts

To become a subscriber, subscribe to our free newsletter services. Our service is free for all.

Continue reading