Did you read the 26 Jan 2021 article on Gold?
Article: Don’t Get Yourself Into a Bull Trap With MCX Gold
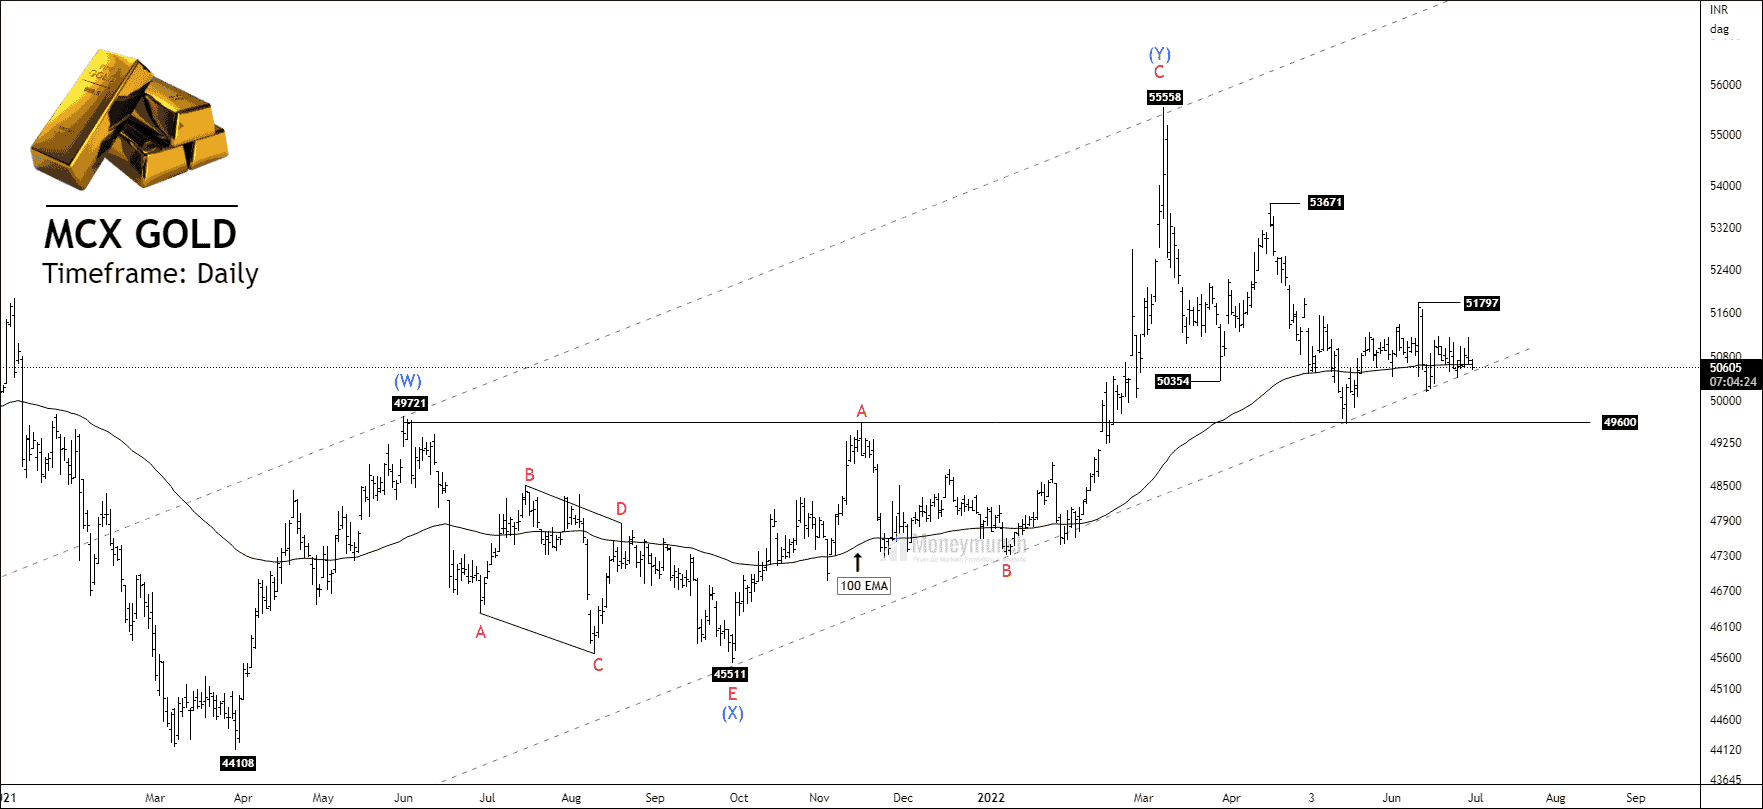
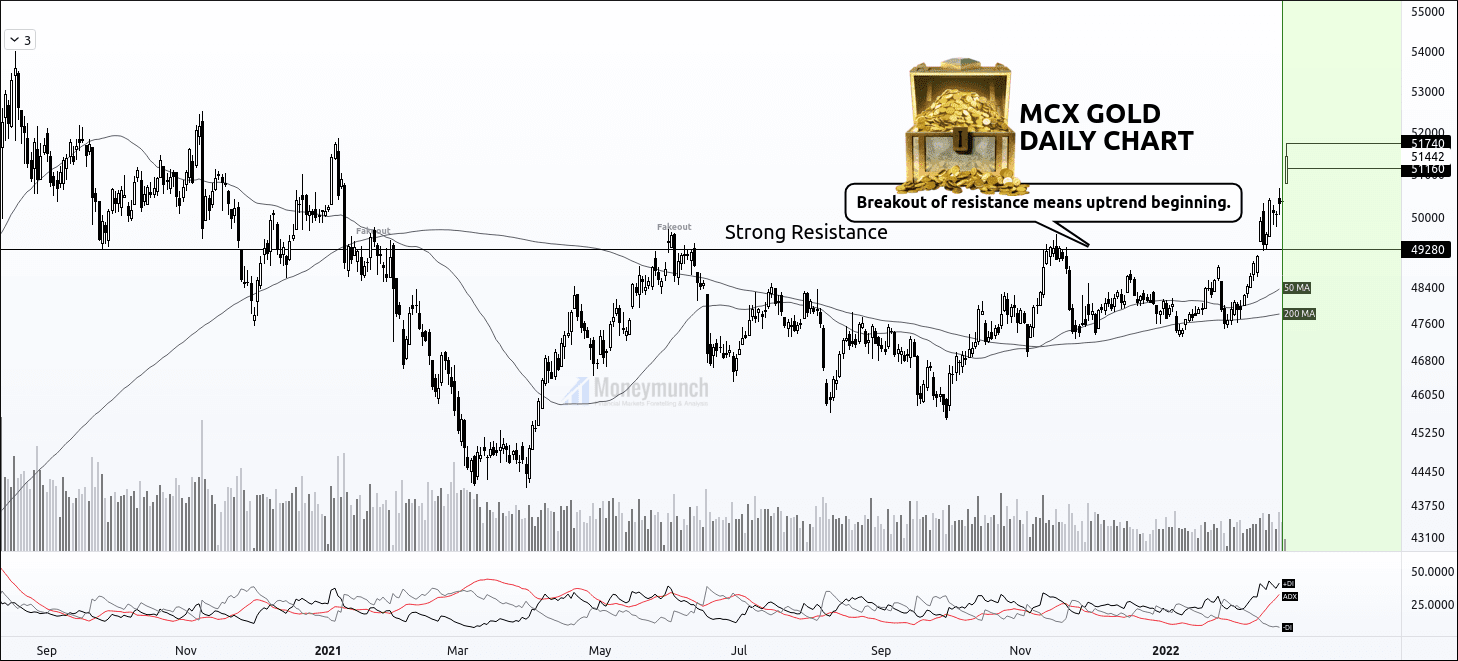
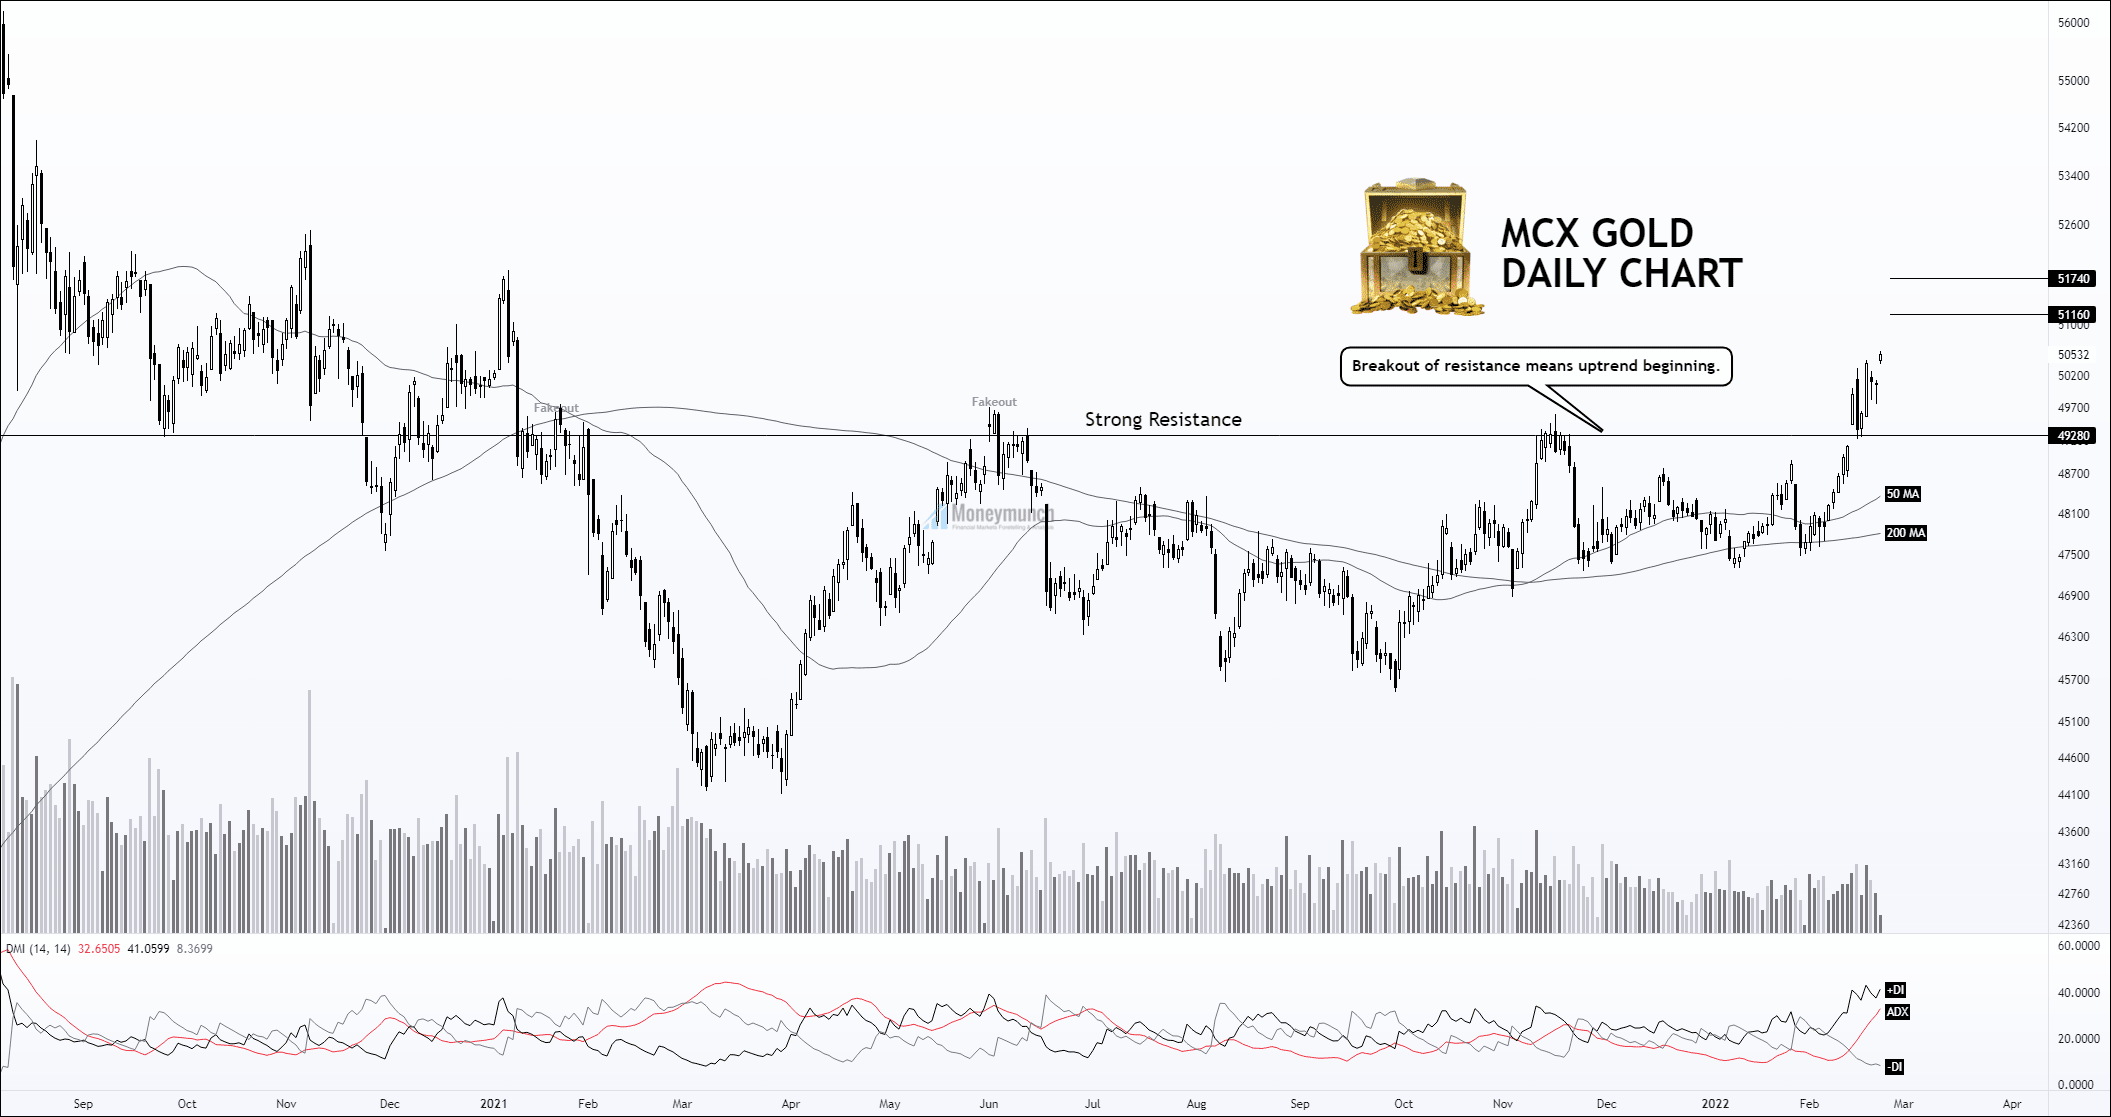
Wherein I have highlighted a strong resistance (SR) which is 49280. It has broken down on 14 Feb 2022. That indicates the MCX gold uptrend is unfolding here. If it consecutively remains above the SR, we will see the gold price above 51160 – 51740.
The following indicators have been indicating impending advance:
ADX, DMI, and MA
Watch significant releases or events that may affect the movement of gold, silver, and crude oil.
Tuesday, Feb 22, 2022
19:30 S&P/CS HPI Composite – 20 n.s.a. (YoY) (Dec) – Medium Impact
20:15 Manufacturing, Markit Composite, & Services PMI (Feb) – Medium Impact
20:30 CB Consumer Confidence (Feb) – High Impact
Thursday, Feb 24, 2022
03:00 API Weekly Crude Oil Stock – Medium Impact
19:00 GDP (QoQ) (Q4), and Initial Jobless Claims – High Impact
21:00 Natural Gas Storage – Low Impact
21:30 Crude Oil Inventories – High Impact
22:30 FOMC Member Mester Speaks – Medium Impact
To become a subscriber, subscribe to our free newsletter services. Our service is free for all.

 Continue reading