Stay ahead in commodity market trading with our daily free Gold and Silver tips, research reports, and trend analysis. Make informed decisions with expert insights.
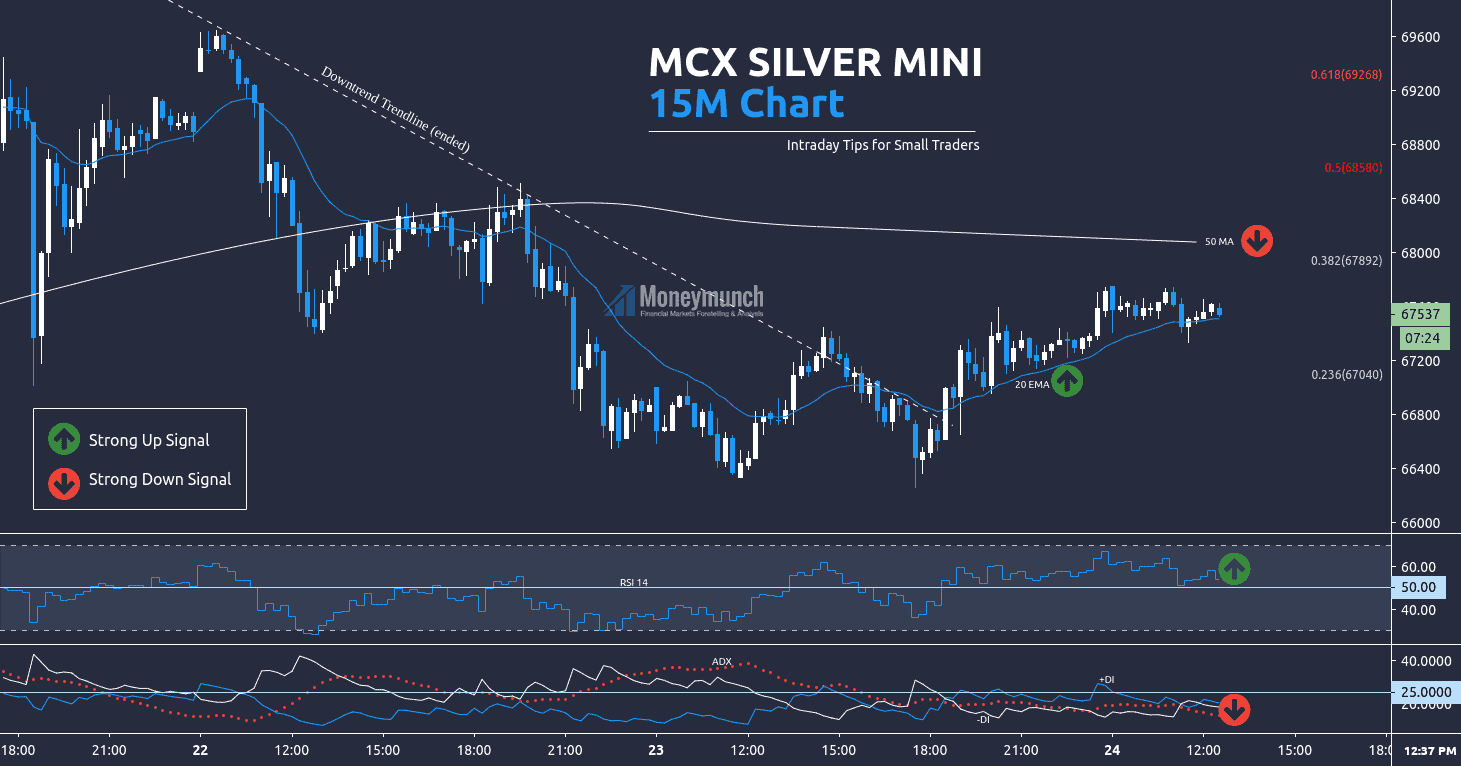
This is MCX Silver mini 15 minutes chart. I have used here moving average, Fibonacci, DMI, and RSI.
Fib Levels: T 71496 and B 65664
Silver will try to touch 0.382 (67892) from here. It will act as resistance. Moreover, there is a 50 MA. If silver breaks both, it will fly from there and touch, 68580 levels. Intraday traders can play between it.
But if it takes a U-turn from 50 MA and breaks the 20 EMA, be ready for the following targets: 67060 – 66600.
To become a subscriber, subscribe to our free newsletter services. Our service is free for all.
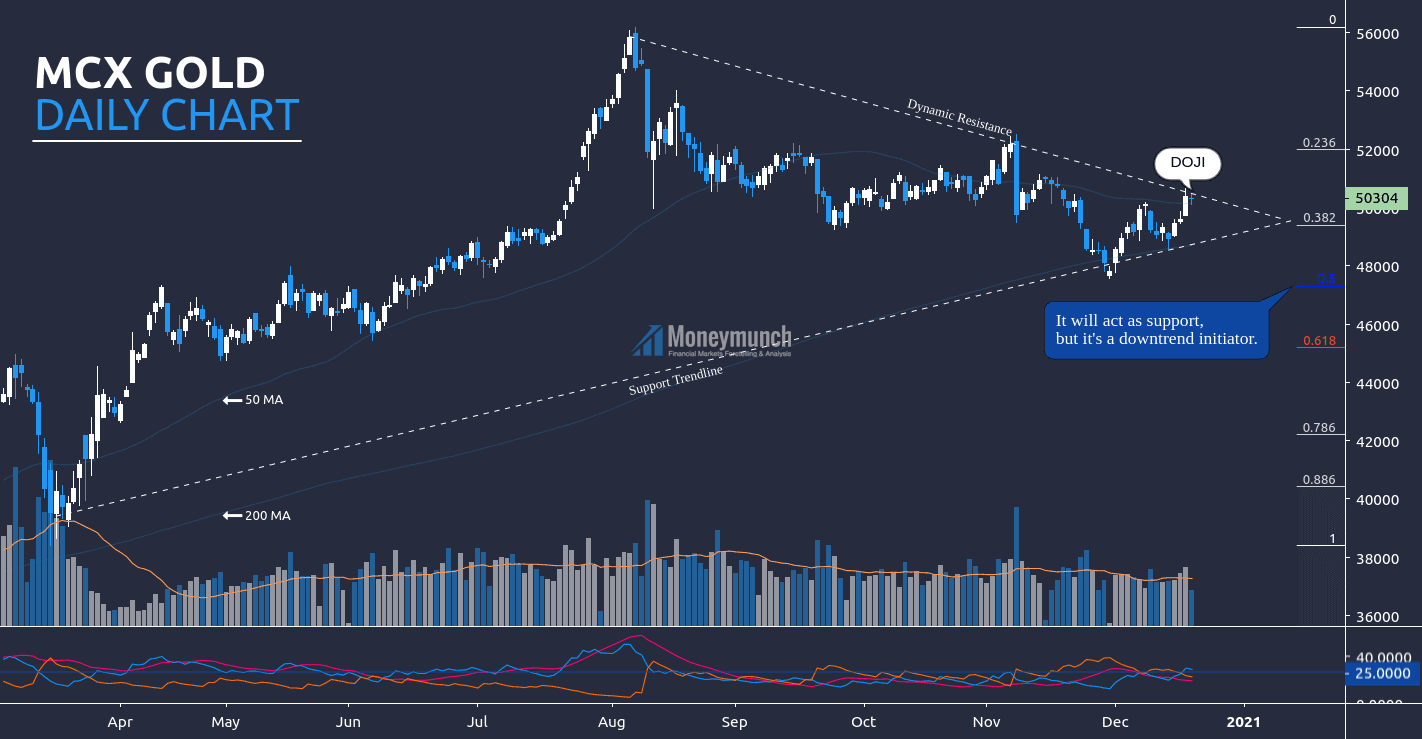
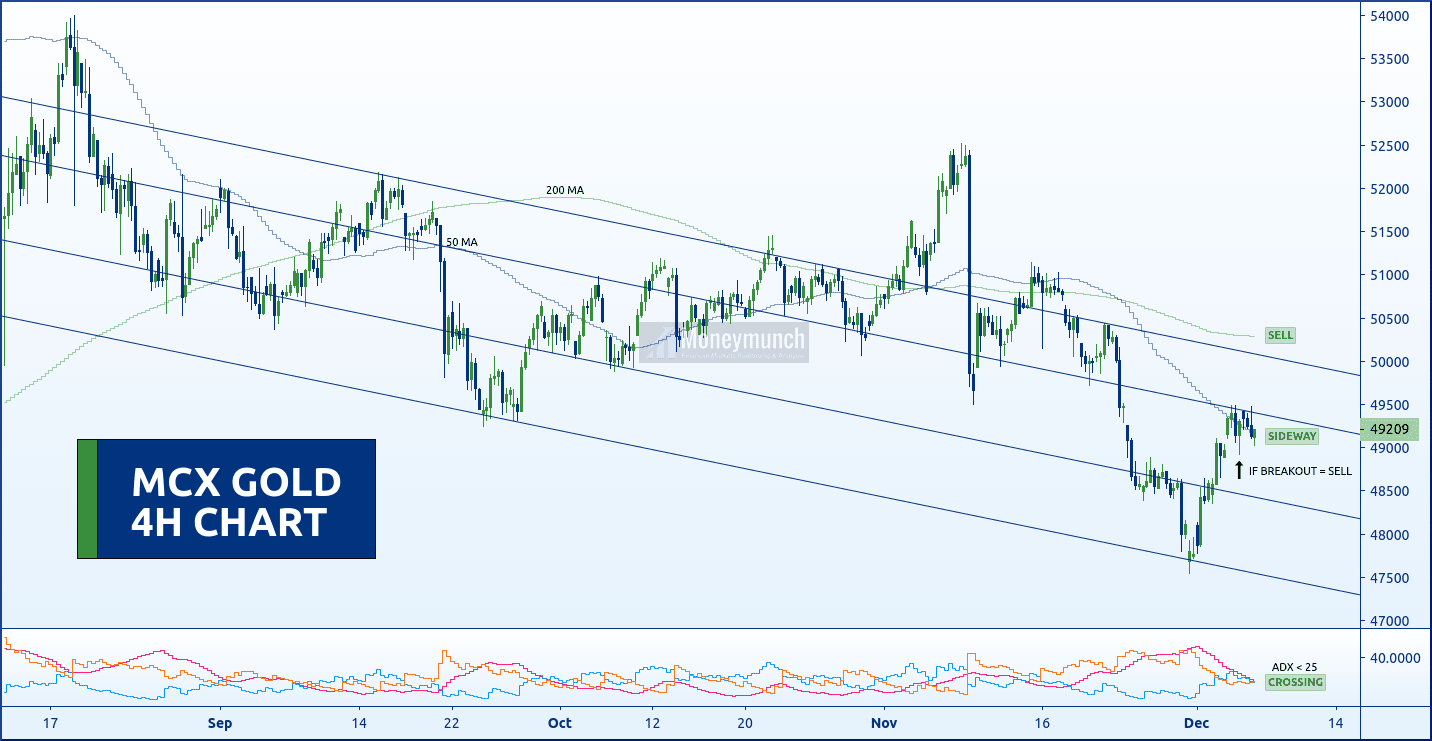
According to this chart, gold has started falling from August month. Doji appearing in the last trading session. It’s signaling a possible reversal. If gold follows the dynamic resistance, we may see a continuous downtrend. That can be up to 0.5 (47300) to 0.618 (45200) of Fib retracement.
Here’s ADX less than 25, and +DI is above the -DI . Additionally, 200 MA & 50 MA is throwing uptrend signals. If we follow the moving average, gold may try to hit 51000 – 51990 (0.236) levels.
Intraday traders should watch dynamic resistance before entering.
Silver Follow Up & Future Predictions For 2020 & 2021 – Part I
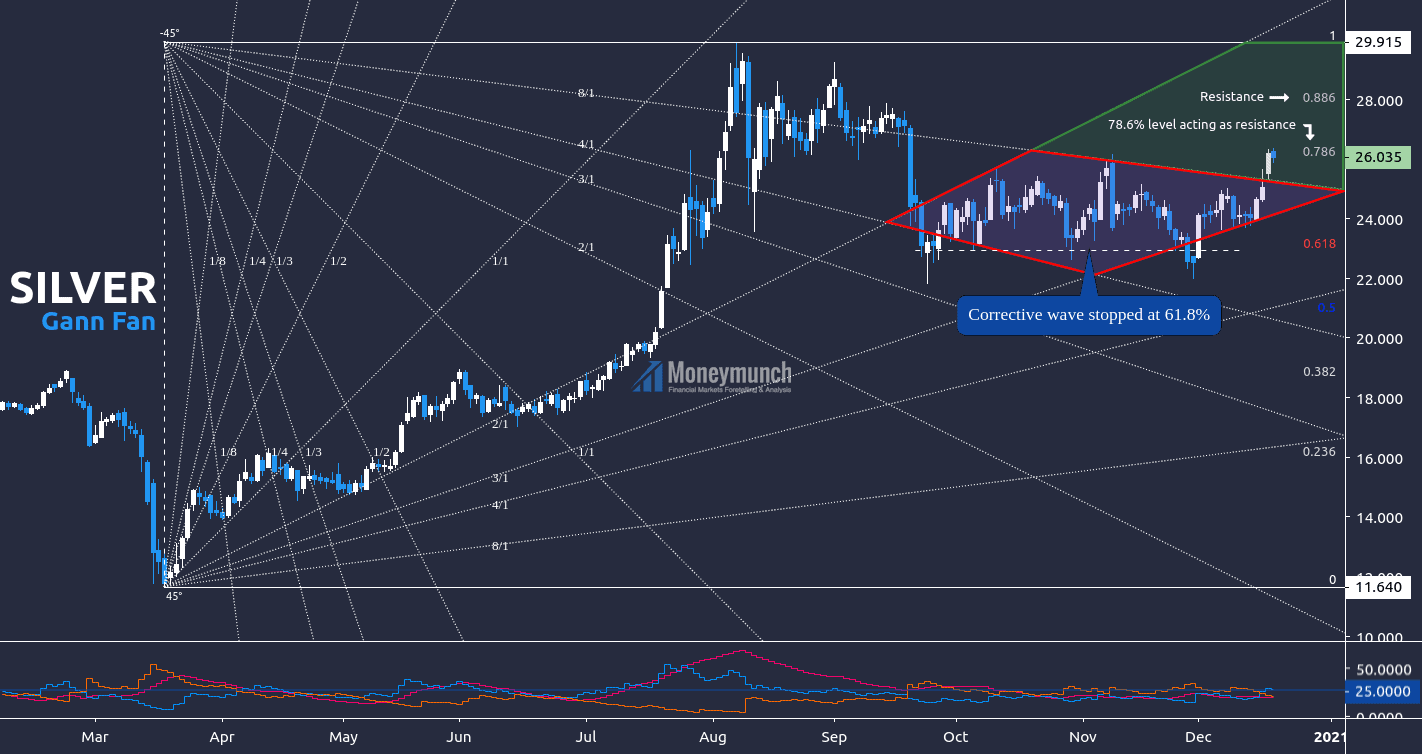
Here I have used Gann fan and Fibonacci on Silver sport to identify the current trend.
Fib Retracement: Top: $29.90 Bottom: $11.64
If silver remains above the 78.6% level, the target will be $27 – $27.8
And if it goes inside 8/1 or remains below 78.6% level, we will see the silver price at 0.618 value of fib retracement. The day traders can use the following levels as targets: $25 – $24 – $23
According to DMI, ADX is less than 25 but turning up. And +DI is signaling an upside rally. Technically, silver is a further advance.
For advance traders, watch significant releases or events that may affect the movement of gold , silver & crude oil: Monday, Dec 21, 2020:
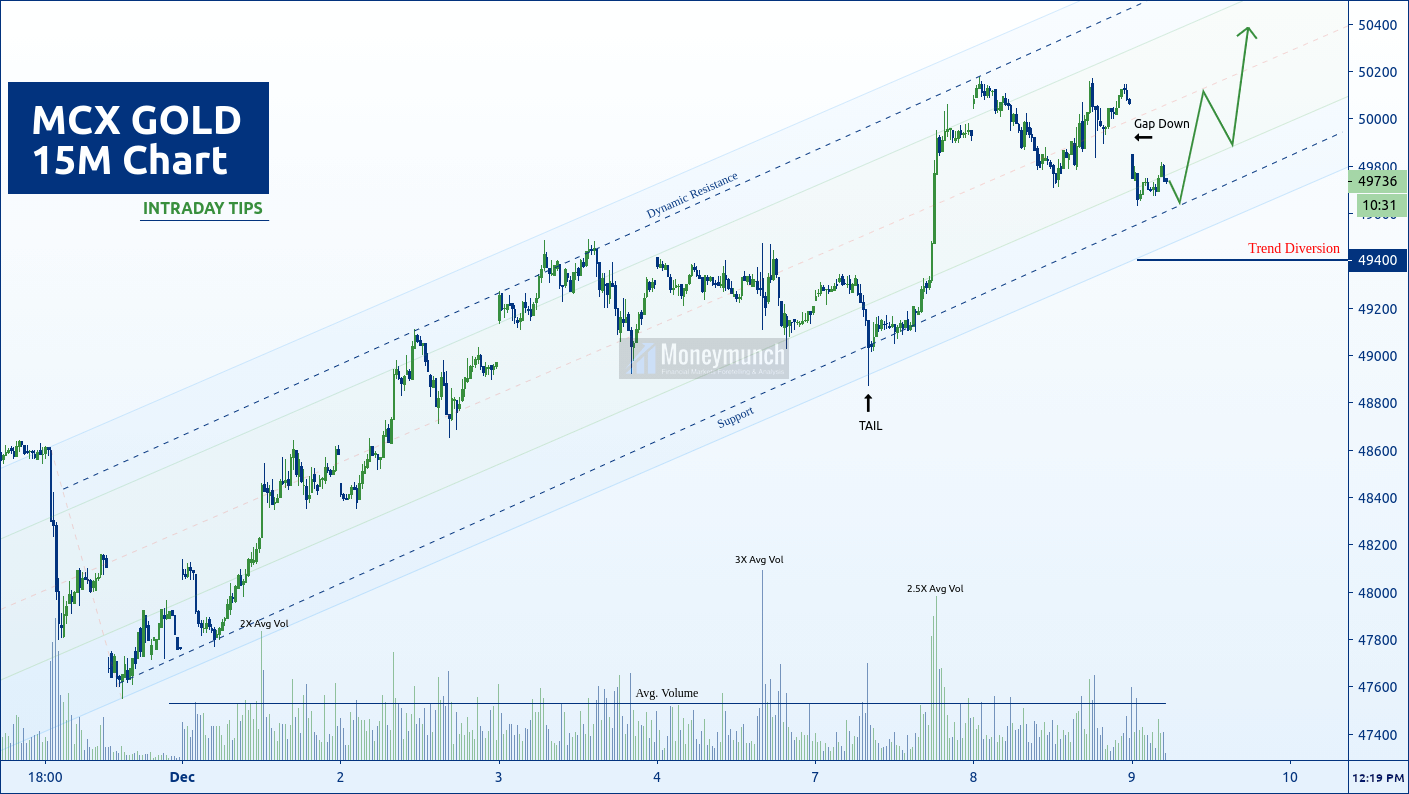
According to this chart, gold is further advance. Intraday traders can see 49860 – 50000 levels soon. We may see 50200 – 50400 in extension before the weekend.
If gold breaks the support trendline, gold can collapse up to the trend diversion point (from 49560 to 49400 levels). Speculators can enjoy both rides.
Once it breaks the support trendline, I will update you.
Note: gap acts as resistance.
To become a subscriber, subscribe to our free newsletter services. Our service is free for all.
Overall, MCX gold is collapsing. Look at the chart, if it breaks a low of 48924, we may see freefall up to 48500 – 48360.
According to 50 MA, gold will try to push the upside. If we see the gold closing price above the second top of the trendline, it will start rising to the levels of 49760 – 50000.
Here ADX is less than 25 and 200 MA throwing a direct sell signal. Please note the crossing of +DI and -DI before taking a new entry.
To become a subscriber, subscribe to our free newsletter services. Our service is free for all.
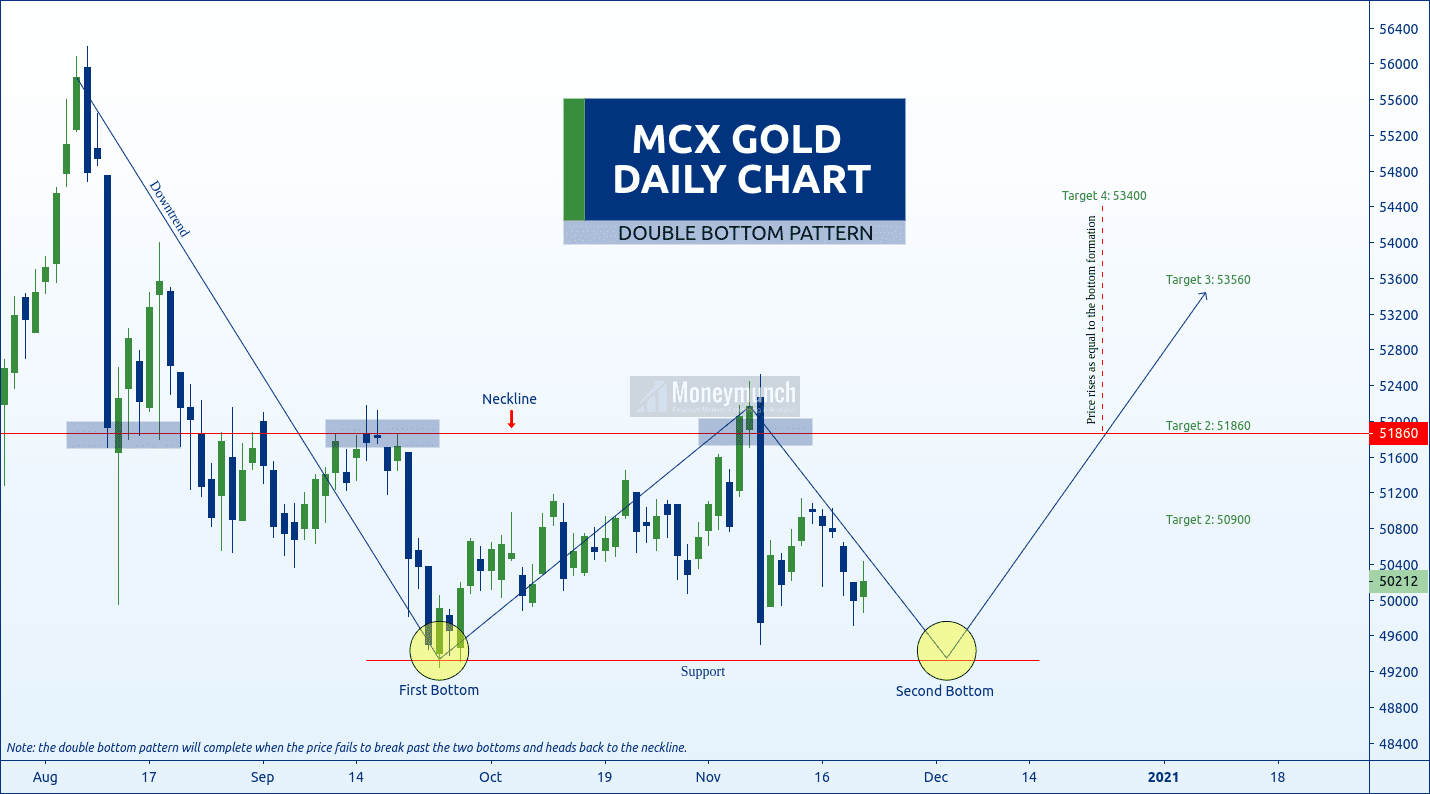
In the last two weeks, MCX gold has lost -2003 points. We may see a continued downtrend up to the support line (Range: 49600 – 49200). Intraday traders can play between free-fall by taking it as a target.
As mentioned in the chart, the double bottom pattern will complete when the price fails to break past the two bottoms and heads back to the neckline.
But if gold fails to complete the double bottom pattern by breaking the support line, we may see continue downward movements. And the gold price will come at/below 48760 – 48000 levels.
If it happens, I will update you ASAP. To become a subscriber, subscribe to our free newsletter services. Our service is free for all.
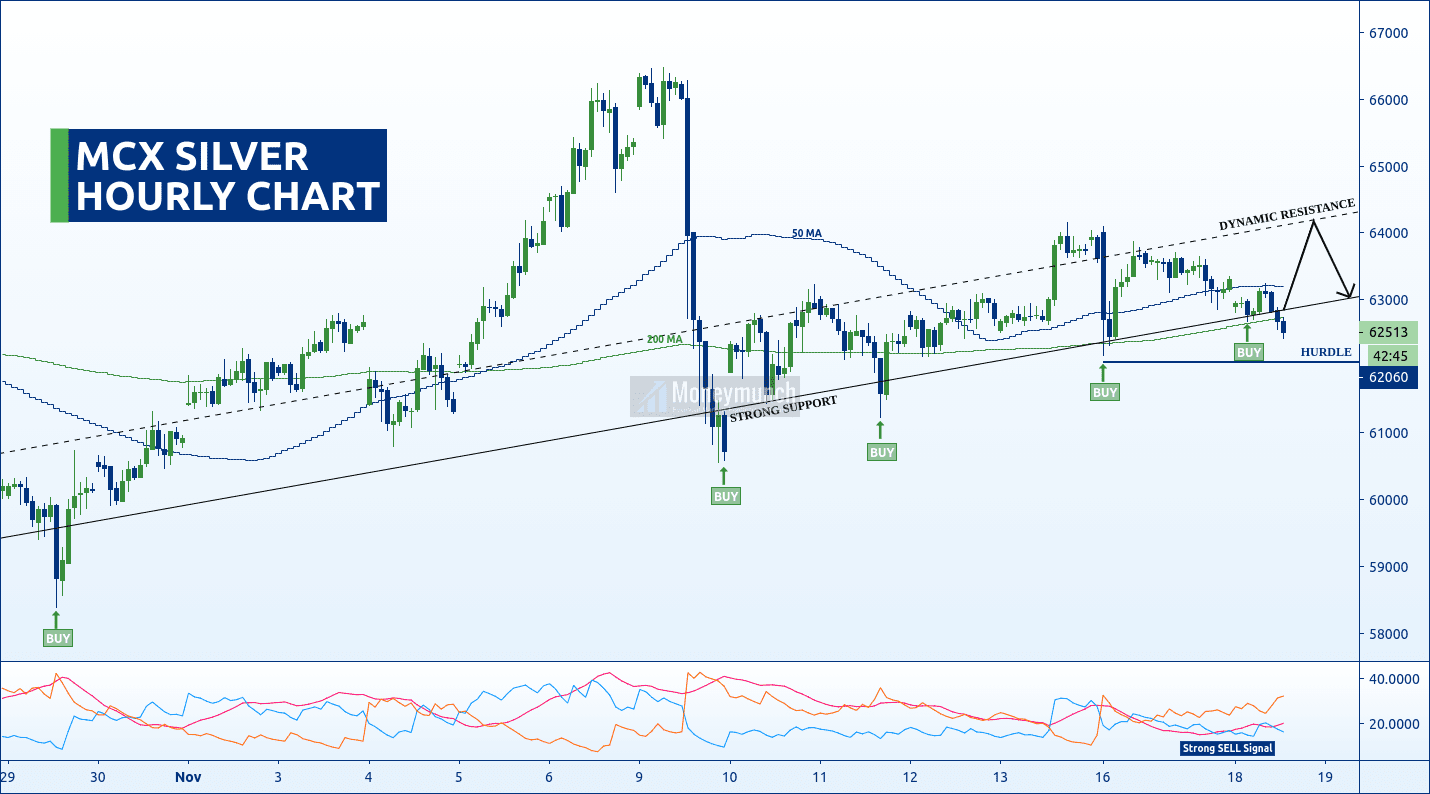
Silver is growing slowly. According to this chart, silver is trying to move upside from the strong support trendline. It’s a potential reversal point based on a support trendline.
Currently, it has broken a strong support trendline. We have chances to see a tail, fakeout, or excess here. That can be up to a hurdle. And the hurdle breakout is a direct sign of a downtrend.
After all, 200 MA is recommending further advance here. So, we can pick the silver mega lot for the targets of 63000 – 63360 – 63660 – 64000+.
Safe traders can wait for a 50 MA breakout before entering as well.
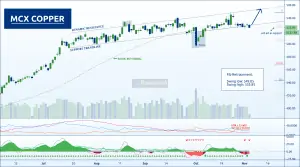
In that newsletter, I had written in bold words, “according to a moving average and parallel channel’s support trendline, copper is strongly bullish. It can show us an all-time new high before the end of this month. So, the day traders can buy for the levels of 536 – 540 – 556+“.
On 16 Nov trading session, copper has made a high of 551 and touched the first two targets.
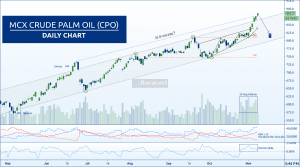
How many of you bought MCX CPO? I had written, “currently, MCX Crude Palm Oil (CPO) shows an uptrend. By following the ADX, we can say that the trend will rise because ADX is greater than 25 (ADX>25), and +DI is above the -DI. Let’s have a look at the volume. Volume spikes double of the average, so this also shows an uptrend, and it will go to the 900 – 920 – 960+“.
Currently, CPO is running nearby 926 levels.
To become a subscriber, subscribe to our free newsletter services. Our service is free for all.