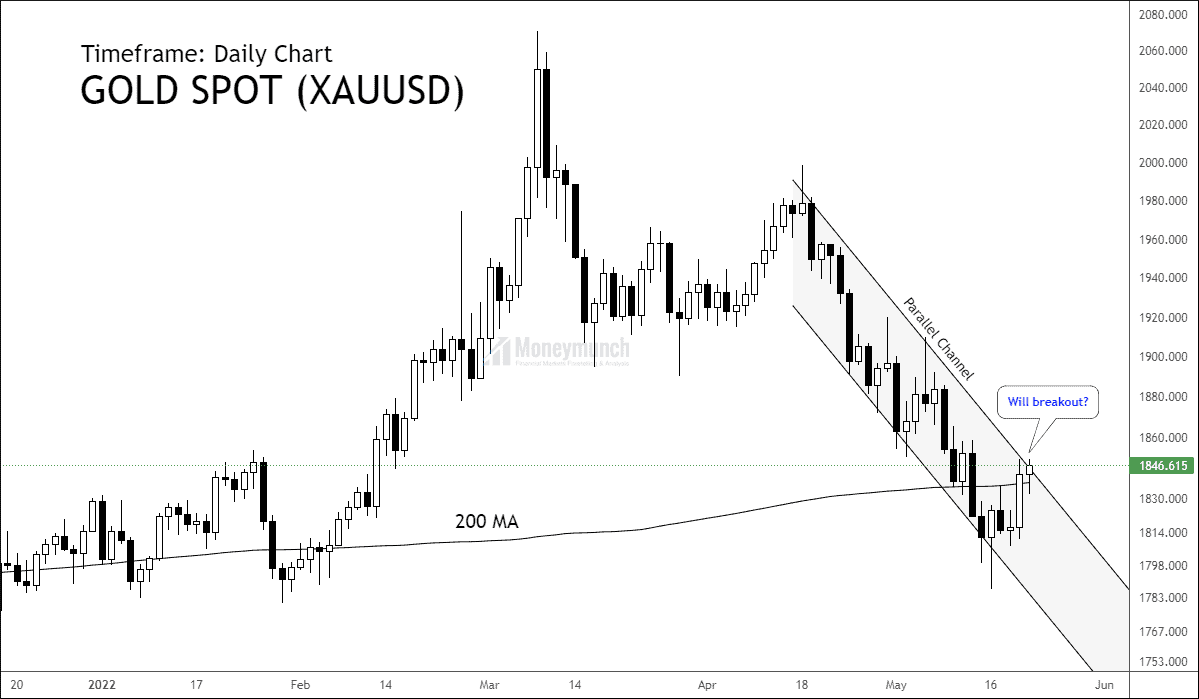
Gold’s Next Bull Leg In Progress
Bull Gateway: 1852 Gold has created three consecutive positive bars in the last 25 trading sessions (36 days) for the first time. And it’s above 200 MA. That’s a good sign for buyers! If gold breaks the parallel channel, my upside targets Continue reading
Gold Price Predictions for 2022
In the previous trading session, MCX Gold made a high of 51538 and closed at 51343 (+444). A question is, is it moving upward?
To identify uptrend:
There are two hurdles to continuing the uptrend. It should break out the 5th May high or settle above the control line.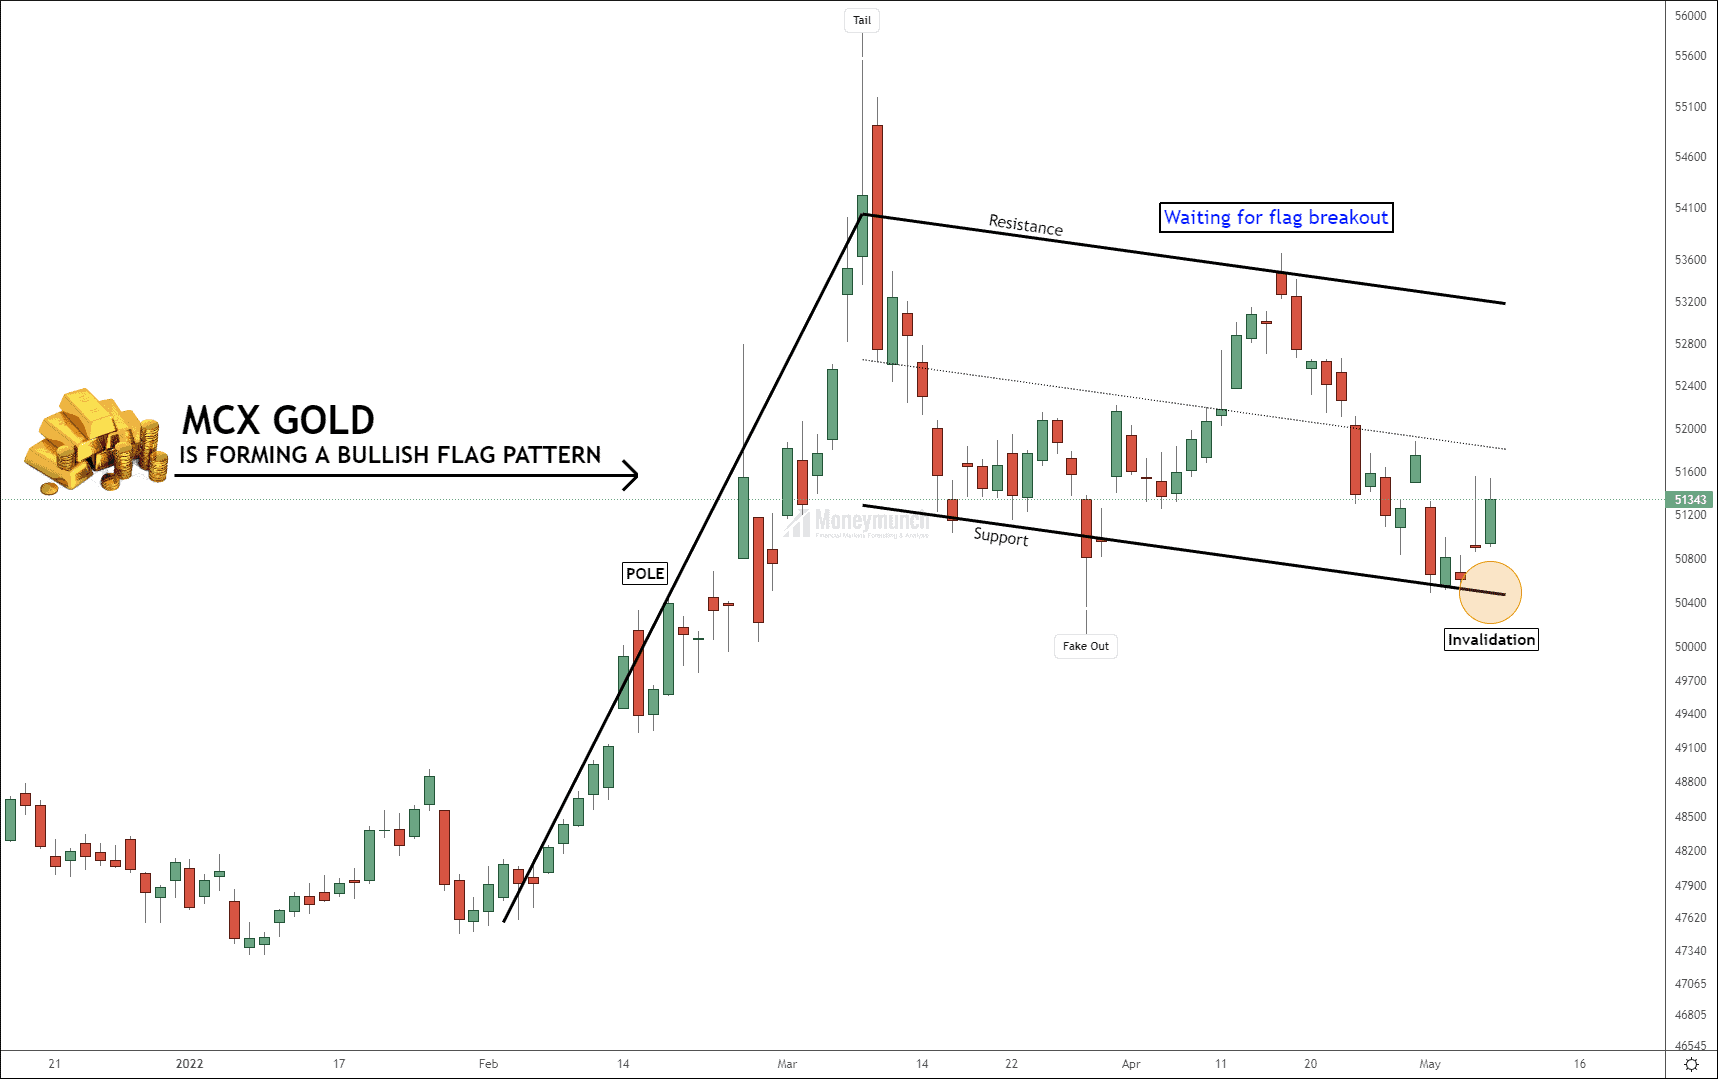 According to the above chart, Gold is forming a bullish flag pattern. And we’re waiting for a breakout of the flag pattern. This breakout will skyrocket the gold price, and we can see 6400+ points of bullish movement here. Long-term target for gold 58000 – 60000.
Gold downtrend confirmation:
Continue readingMCX Gold & Nickel – Profit Booking Time
Did you read the gold report? If not, click the below link.
22 Feb 2022: MCX Gold’s Bullish Mode Activated
While the gold price at 50532, I had written, “we will see the gold price above 51160 – 51740“.
Today, it has touched the first & second target. Who bought it? Profit per lot: Rs.1,20,800
I have updated a full report of Nickel on Feb 6, 2022. Did you read it? If not, click the below link:
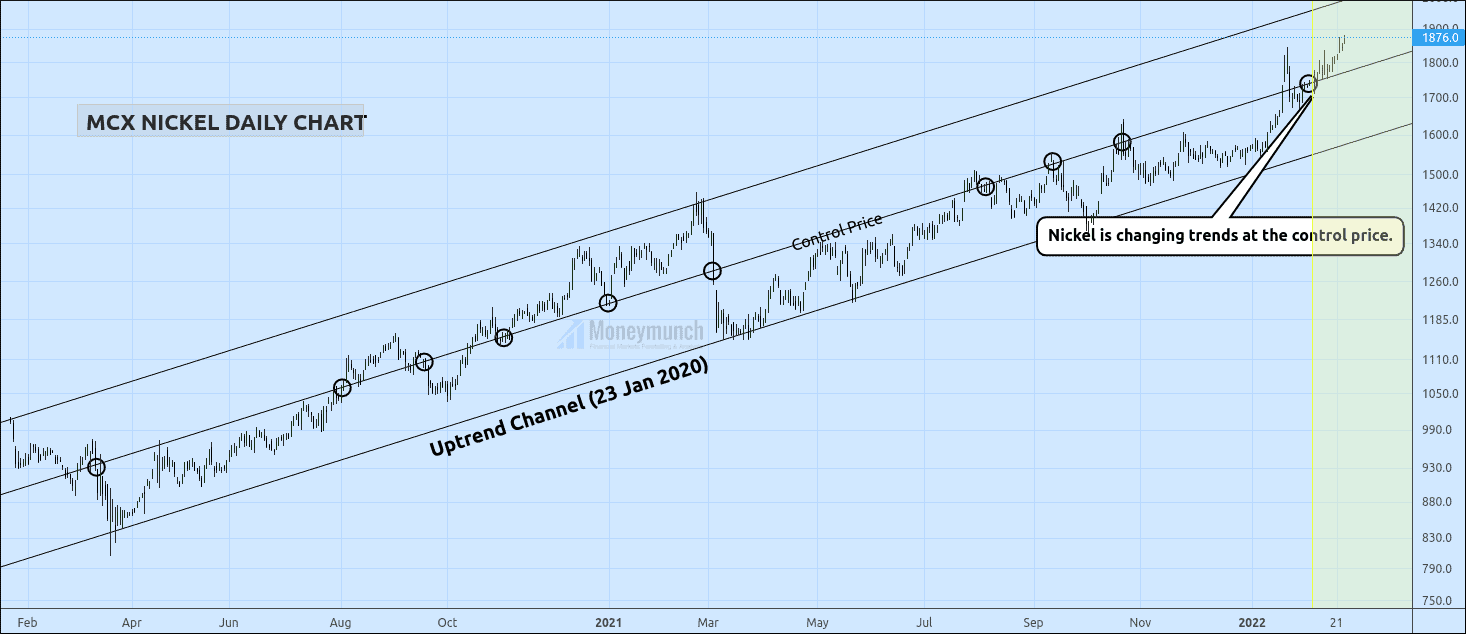
2020’s Uptrend Channel Is Everything For MCX Nickel
I had written, “It’s a sign for a buy signal. But intraday or short-term investors should confirm that breakout before proceeding. And they must look out for candle’s fakeout. Afterward, be ready for the targets of 1800 – 1840 – 1876+“.
Today nickel has touched all targets. Who bought it? The target was 133.4 points. Profit per lot: Rs.2,00,100
What else do you need from a free subscription!? To become a subscriber, subscribe to our free newsletter services. Our service is free for all.
Continue reading
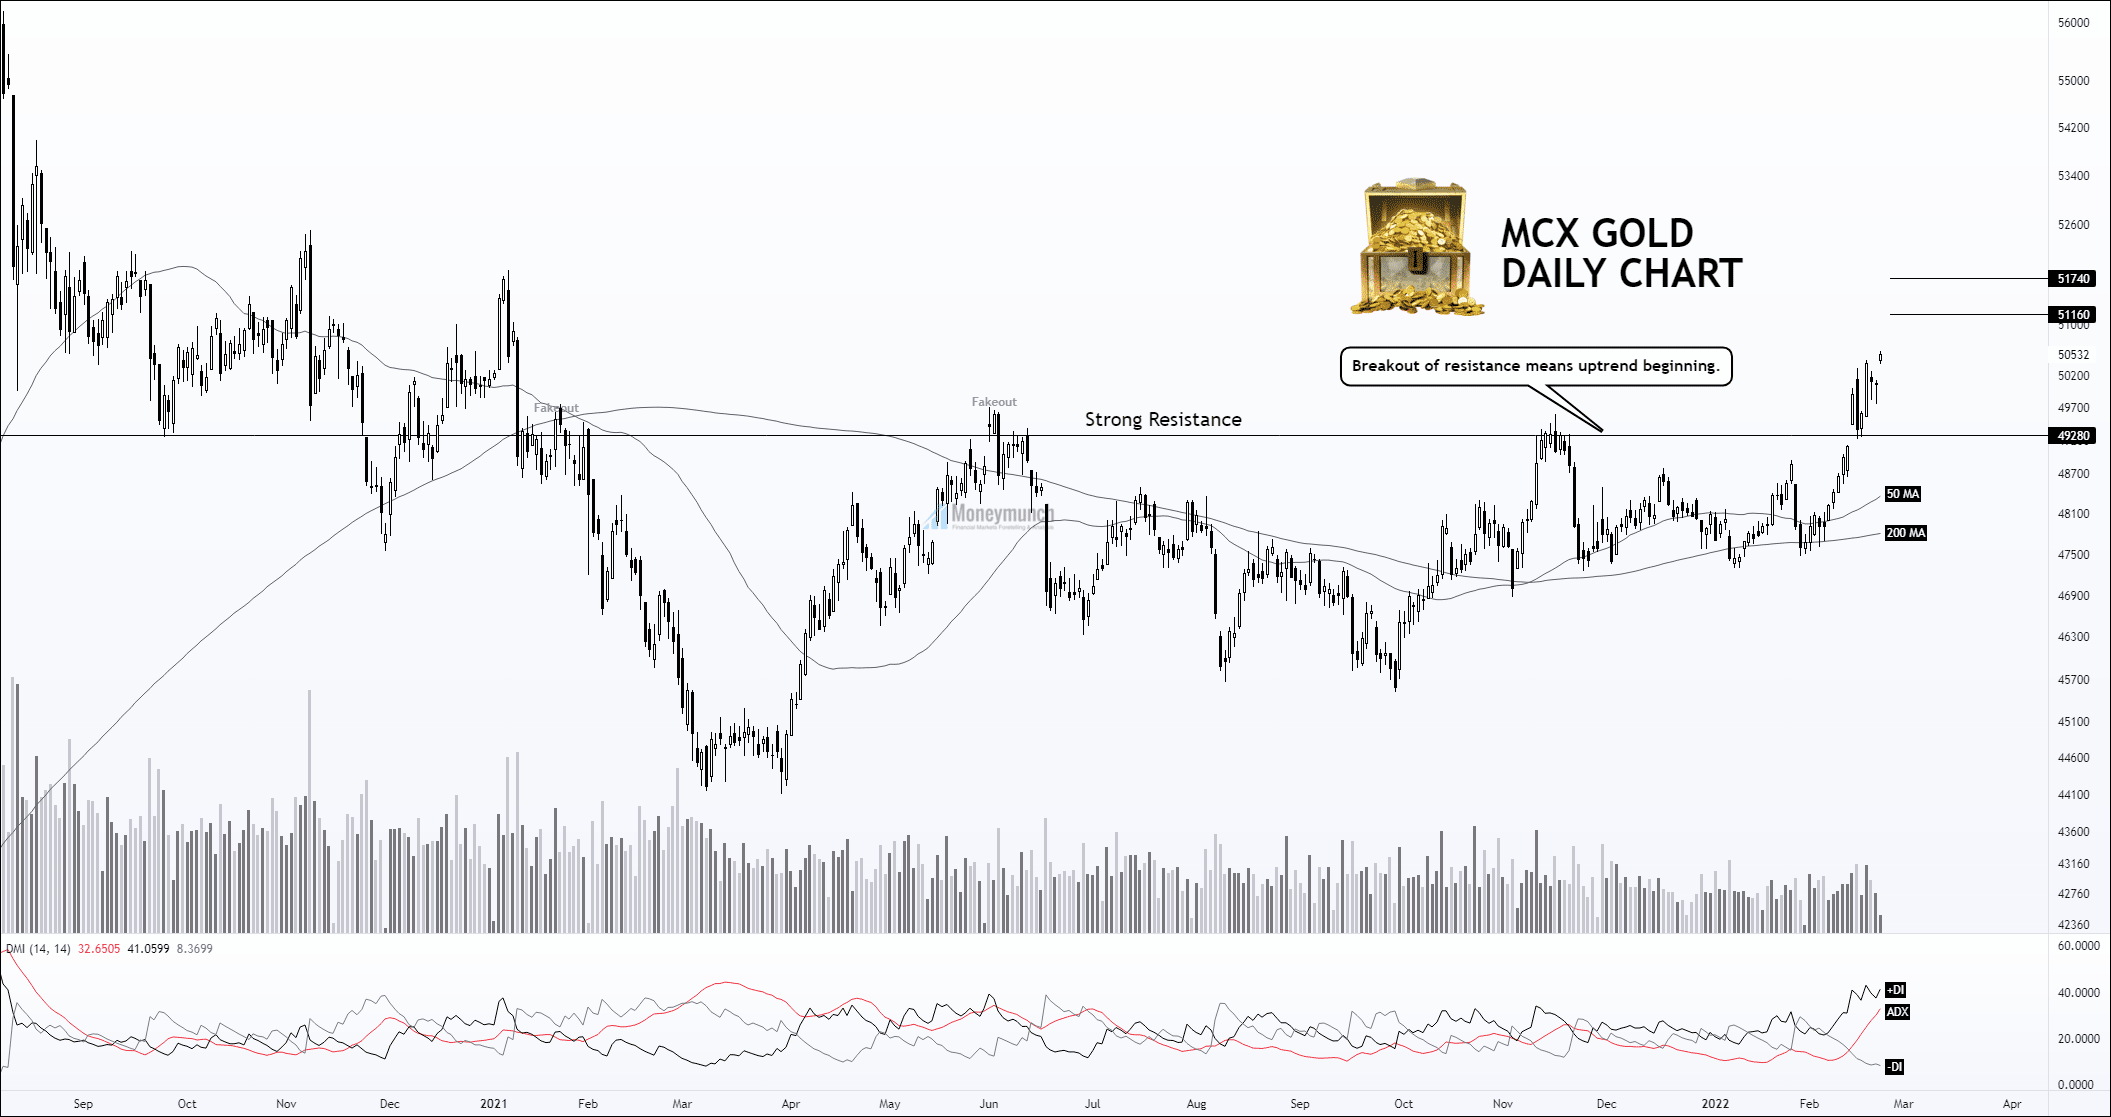
MCX Gold’s Bullish Mode Activated
Did you read the 26 Jan 2021 article on Gold?
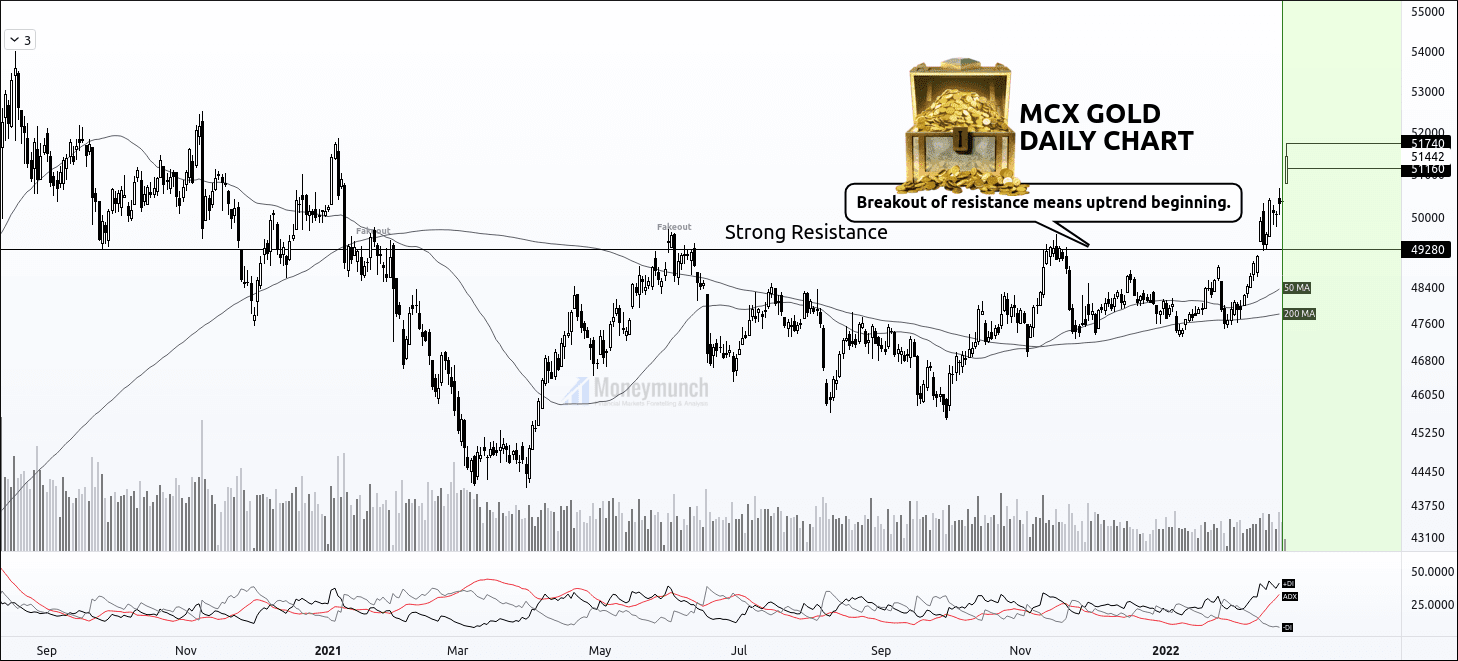
Article: Don’t Get Yourself Into a Bull Trap With MCX Gold
Wherein I have highlighted a strong resistance (SR) which is 49280. It has broken down on 14 Feb 2022. That indicates the MCX gold uptrend is unfolding here. If it consecutively remains above the SR, we will see the gold price above 51160 – 51740.
The following indicators have been indicating impending advance:
ADX, DMI, and MA
Watch significant releases or events that may affect the movement of gold, silver, and crude oil.
Tuesday, Feb 22, 2022
19:30 S&P/CS HPI Composite – 20 n.s.a. (YoY) (Dec) – Medium Impact
20:15 Manufacturing, Markit Composite, & Services PMI (Feb) – Medium Impact
20:30 CB Consumer Confidence (Feb) – High Impact
Thursday, Feb 24, 2022
03:00 API Weekly Crude Oil Stock – Medium Impact
19:00 GDP (QoQ) (Q4), and Initial Jobless Claims – High Impact
21:00 Natural Gas Storage – Low Impact
21:30 Crude Oil Inventories – High Impact
22:30 FOMC Member Mester Speaks – Medium Impact
To become a subscriber, subscribe to our free newsletter services. Our service is free for all.
Continue reading
Is Silver(XAGUSD) Ready For Trend Change?
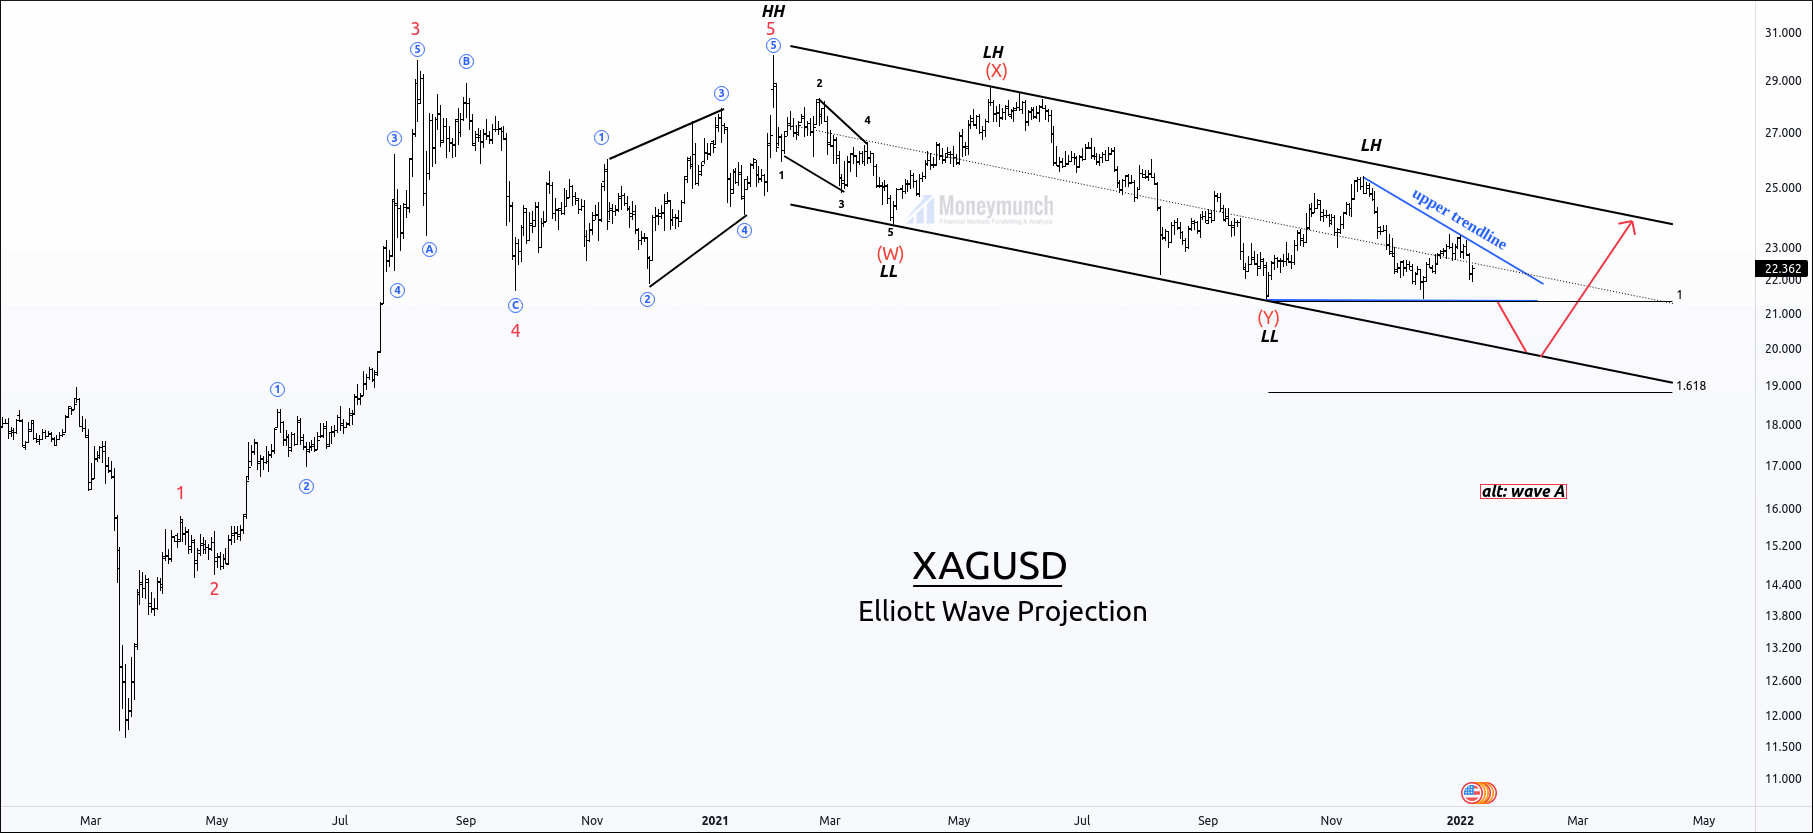
Silver(XAGUSD) has formed a downtrend channel for more than 48 weeks. Price has made a high of 30.03, and sellers entered the market.
Price Action Perspective:
Price has made a series of Lower Highs and Lower Lows, and the control line gives nine touches.
According to Dow theory, if the price breaks the previous LL, it will make a new LL. The upper band & lower band has provided strong reversals to the price.
After breaking the LL, if the price gives a breakout of the downtrend channel, it indicates the worst fundamentals. And if the price gets reversed to create the lower band of the downtrend channel, the price will march to the upper band touch.
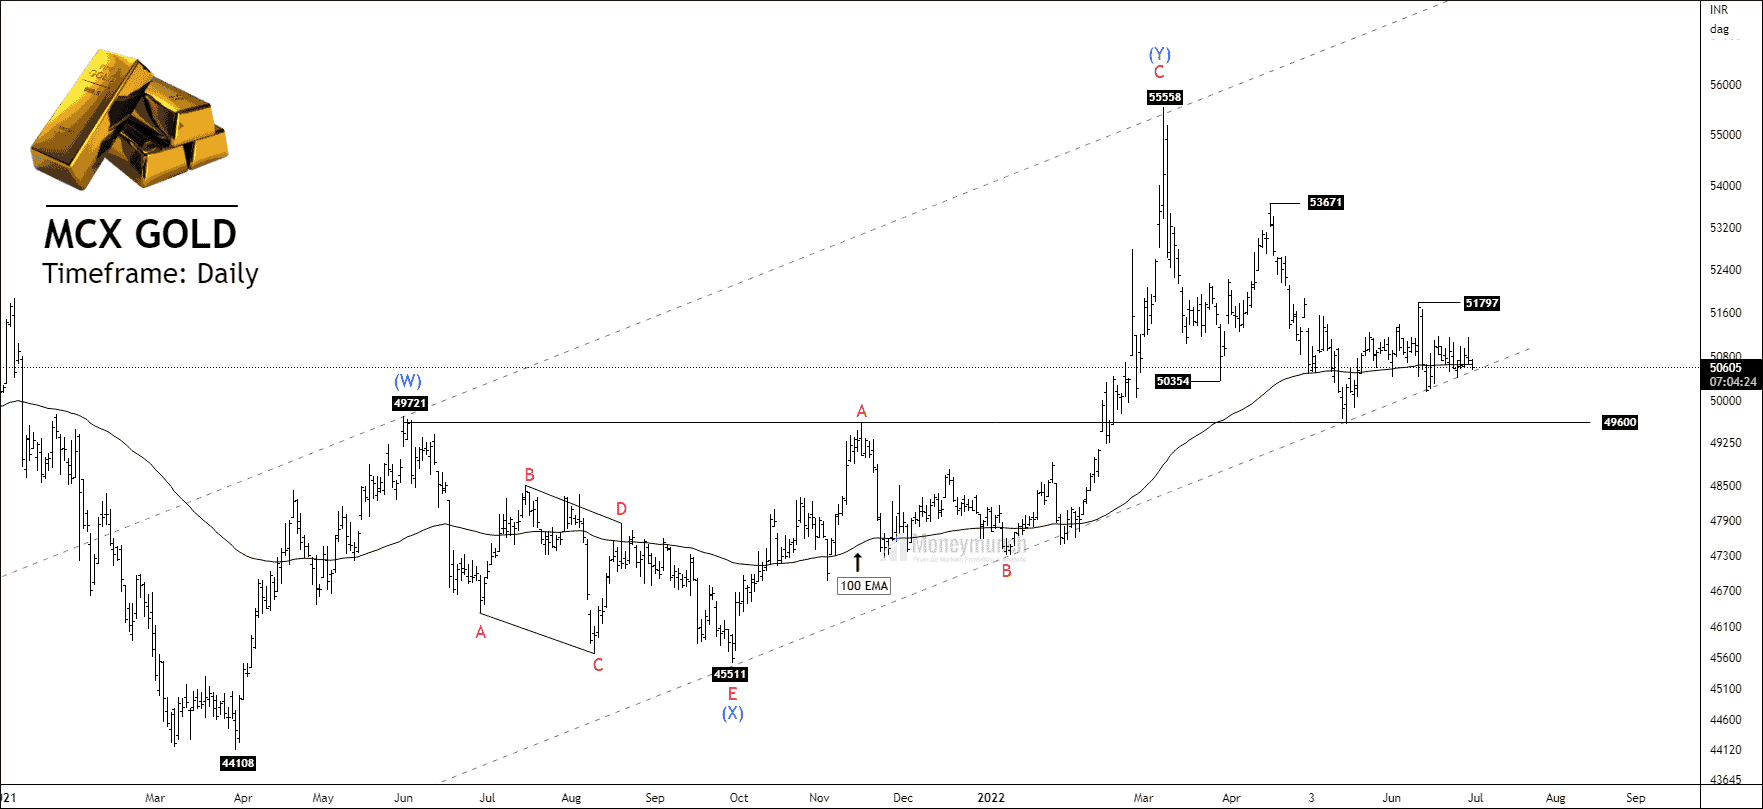
Elliott Perspective:
Price has constituted a corrective structure, where price has completed double zigzag(w-x-y).
It will create the last leg wave Z in order to complete the Triple correction. After making the last leg Z, silver will start a five-wave impulsive wave.
To become a subscriber, subscribe to our free newsletter services. Our service is free for all.
 Unlock This Article
Only subscribers can read the full article. Please login to read the entire article.
Continue reading