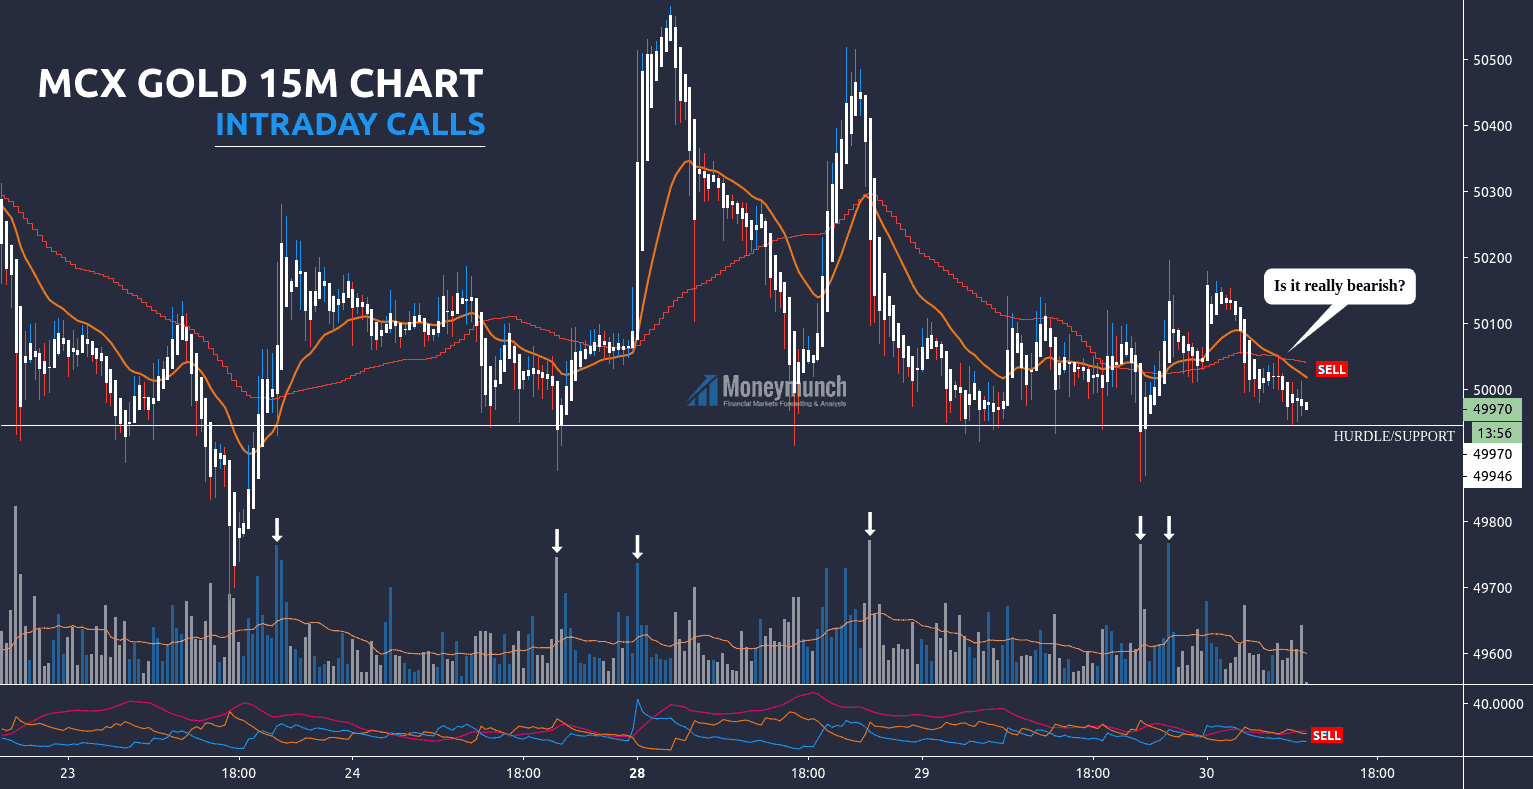
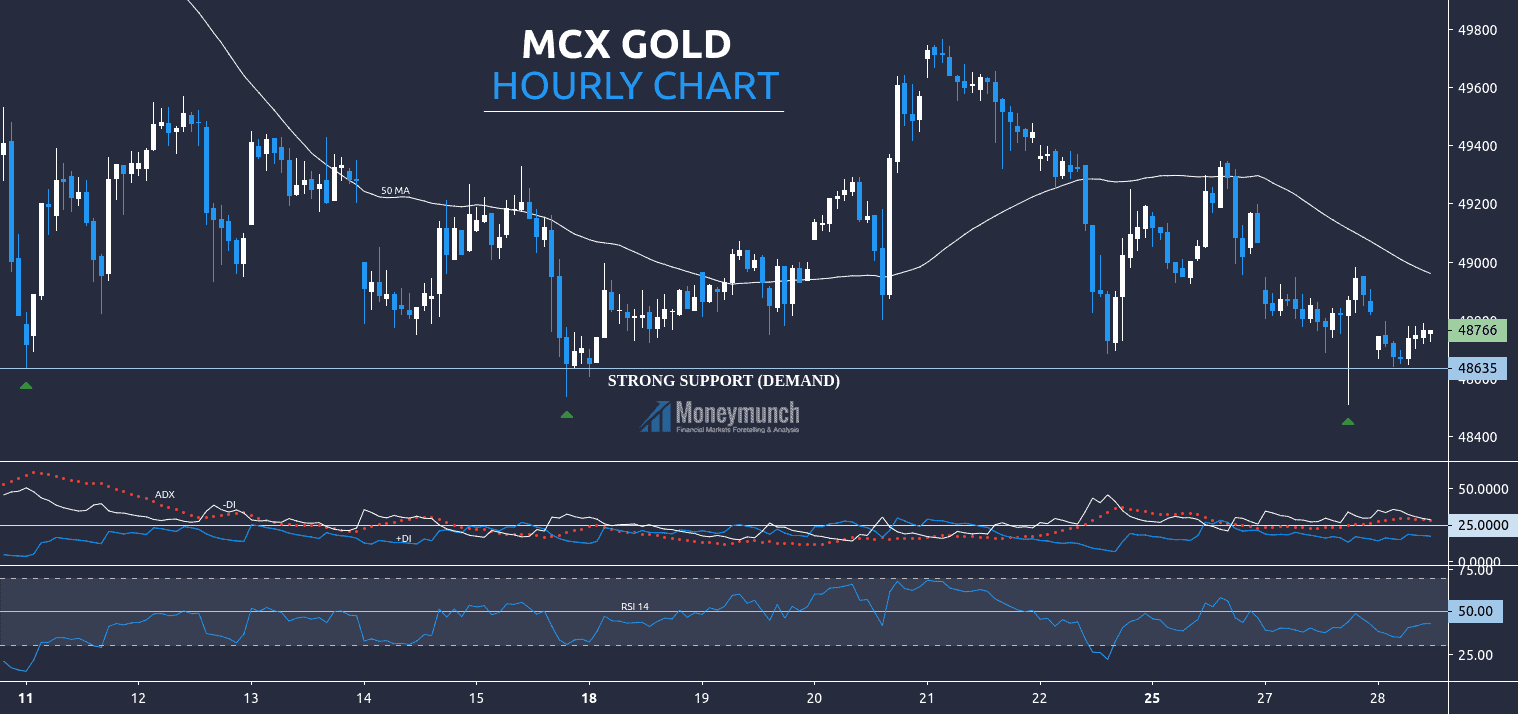
MCX Gold Measured Moves
Gold has made a Doji in the weekly chart. It’s a direct sign of a reversal. And wherein ADX is less than 25 but +DI above the -DI. Additionally, the 20 MA line is trying to stay downside.
In short, DMI & MA is throwing a strong upward signal. Moreover, its volume is increasing. This week, we have chances to see gold prices above the 51860 levels. The day traders can follow the following targets:
51000 – 51360 – 51860+
And short-term investors can hold for 52000 – 53000 – 53560+ levels.
All you need to do is watch out for a dynamic support trendline. It should remain above it. Else, it will start falling. And that downfall for the levels of 50000 – 49600 – 49360.
Significant releases or events that may affect the movement of gold & crude oil:
Monday, Nov 02, 2020
- 11:00 – Gold Index
Tuesday, Nov 03, 2020
- 05:30 – U.S. Presidential Election
Wednesday, Nov 04, 2020
- 02:00 – U.S. API Weekly Crude Stock
- 21:00 – U.S. Crude Oil Inventories
Crude Oil Price Setting Up For A Downside Price Rotation
First, let’s talk about the previous update of crude oil . There, I have drawn the symmetrical triangle bearish pattern on the hourly chart of MCX’s crude oil.
I had written for the day traders, “…the last expected stop is at E. So, we may see crude oil at/below 2840 – 2820 level”.
THESE TARGETS HAS REACHED.
And for the short-term traders, I had written in bold words, “this symmetrical triangle base range is 378 points. So, the game will begin whenever crude oil will break out the triangle pattern . Downward breakout’s targets: 2610 – 2500 – 2460“.
Crude oil has touched the first target (2610) by making a low of 2606 level on 29 Oct ’20. Now let’s come to the point, will crude hit the second & last target or not?
CRUDE OIL DOWNSIDE BREAKOUT ALERT!
If crude oil prices break out the 2600 level, we will see 2540 – 2500 – 2460 levels before the weekend.
Please note that don’t sell it above the 2600 level.
To become a subscriber, subscribe to our free newsletter services. Our service is free for all.