To become a subscriber, subscribe to our free newsletter services. Our service is free for all.
Continue reading
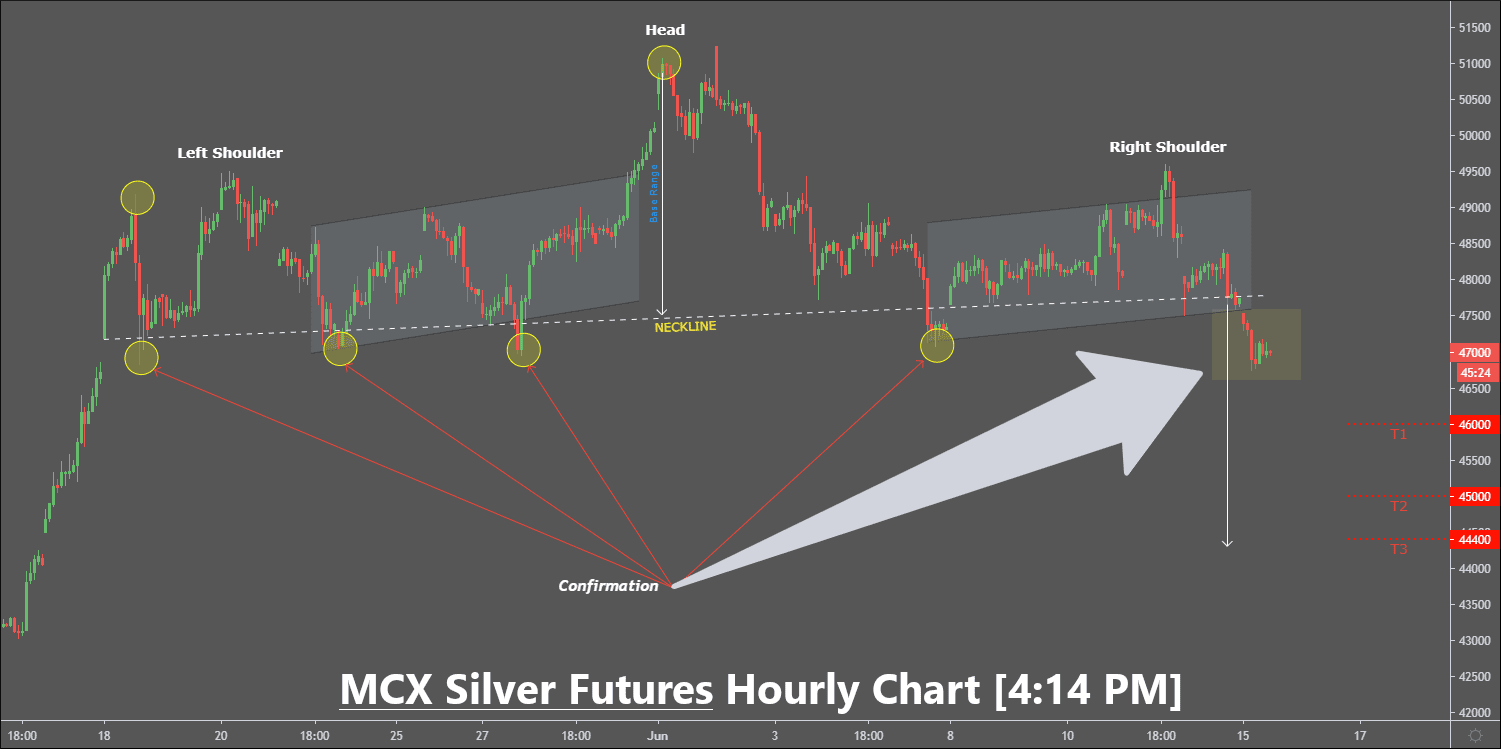
Stay ahead in commodity market trading with our daily free Gold and Silver tips, research reports, and trend analysis. Make informed decisions with expert insights.
To become a subscriber, subscribe to our free newsletter services. Our service is free for all.
To become a subscriber, subscribe to our free newsletter services. Our service is free for all.
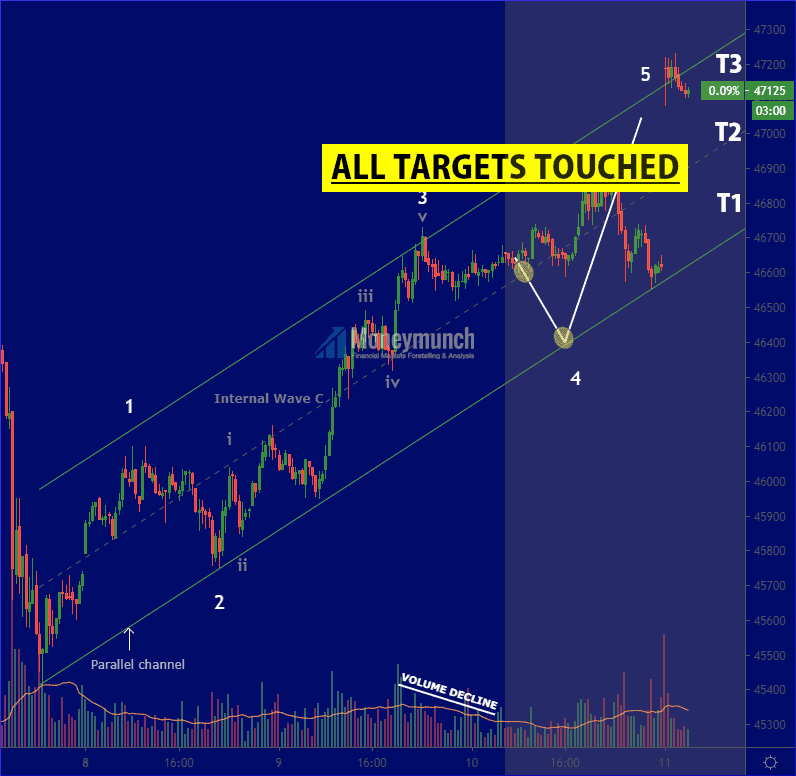
First, read yesterday’s gold call report: Expectations For Higher MCX Gold Prices (15M Elliott Wave)
I had written at 11:56 AM, “Support: 46400 – 46360
Targets: 46800 – 47000 – 47200“.
Gold call all targets has come. What else you want?
To become a subscriber, subscribe to our free newsletter services. Our service is free for all.
To become a subscriber, subscribe to our free newsletter services. Our service is free for all.
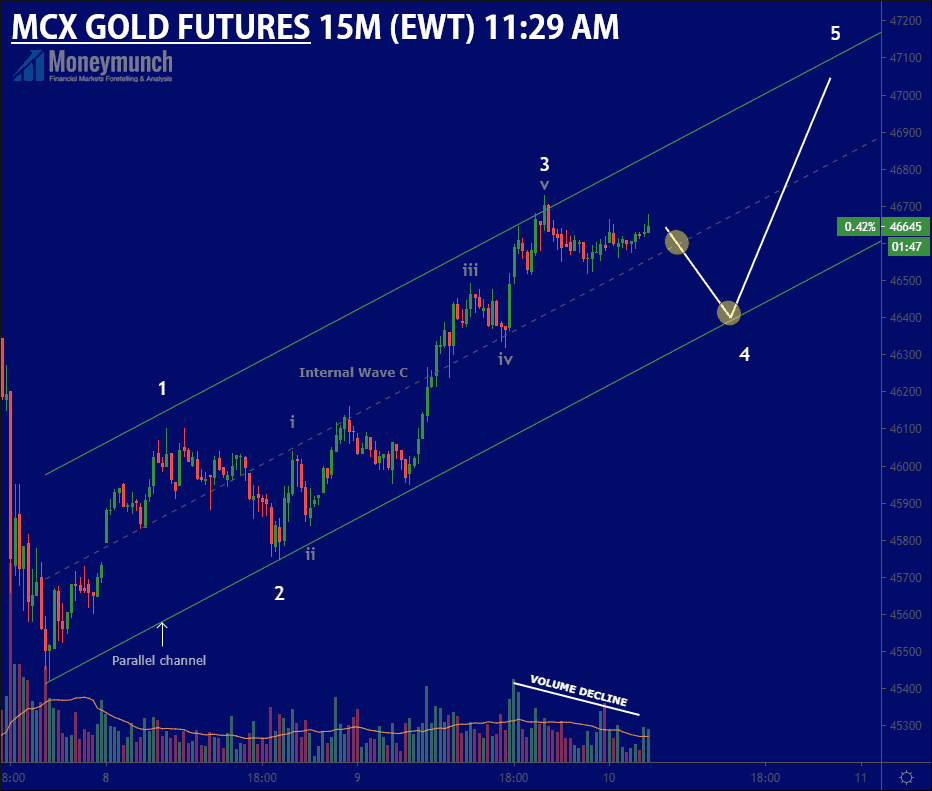
Support: 46400 – 46360
Targets: 46800 – 47000 – 47200
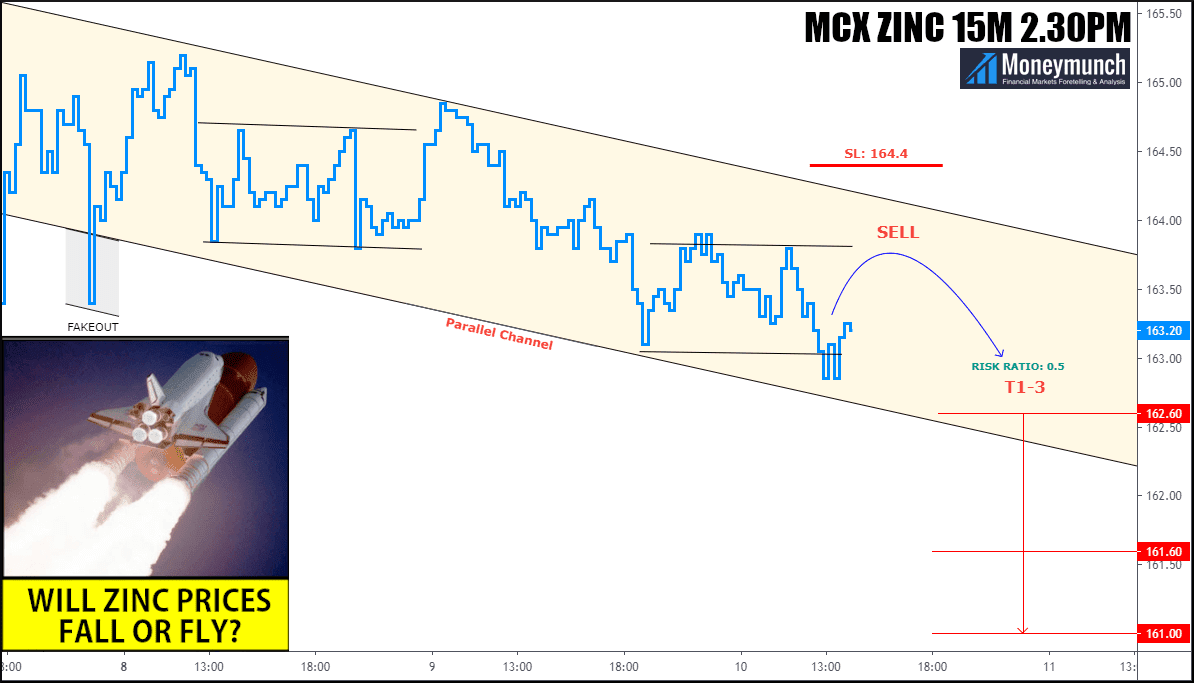
A breakout of the parallel line means downfall. Beware of fake out. It can fall the prices around 46100 – 46060.
To become a subscriber, subscribe to our free newsletter services. Our service is free for all.
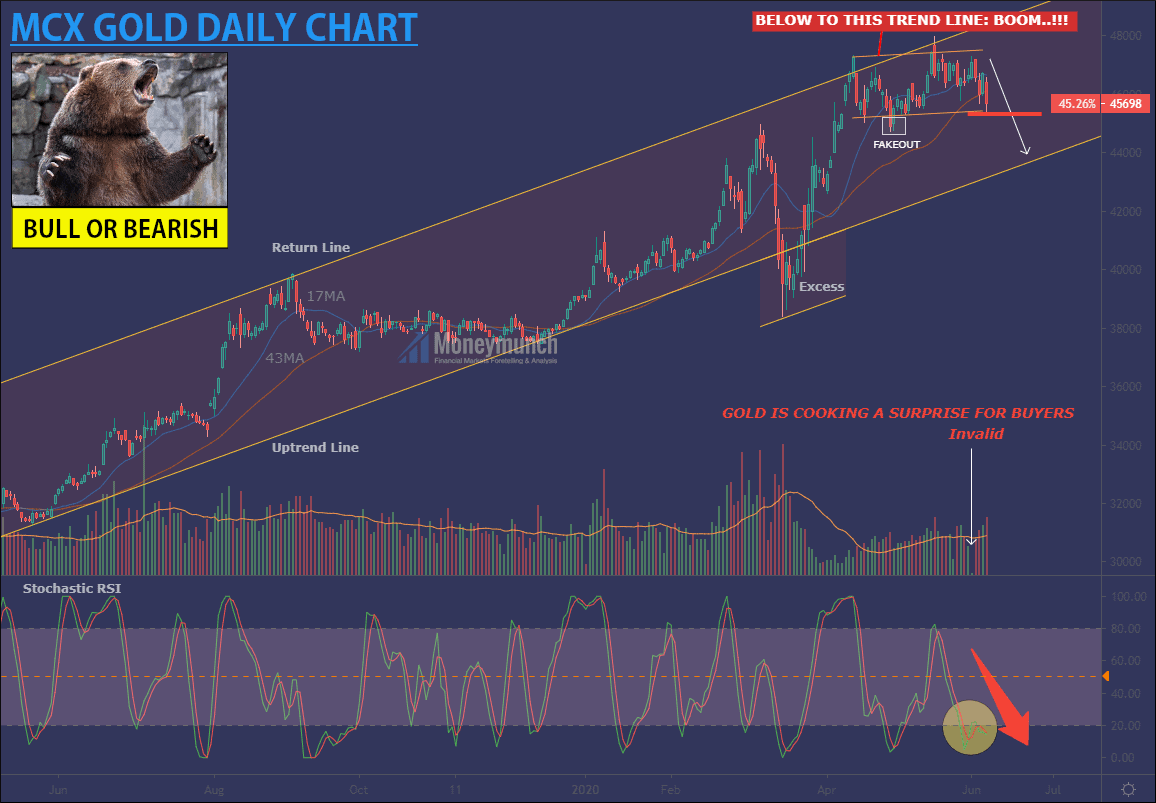
As per vol spike and stochastic RSI sign, gold will perform downside. It could hit 44000 – 43860 levels.
Keep your eyes peeled at 45300 levels. Above it, 46500 – 47300+ levels are waiting. Intraday traders can use it as a hurdle.
Don’t forget to note down fake out.
To become a subscriber, subscribe to our free newsletter services. Our service is free for all.
 Unlock This Article