Have You Traded NSE Balrampur Chini call?
NSE Balramchin – Traders are Anticipating Bullish scenario
 BEFORE
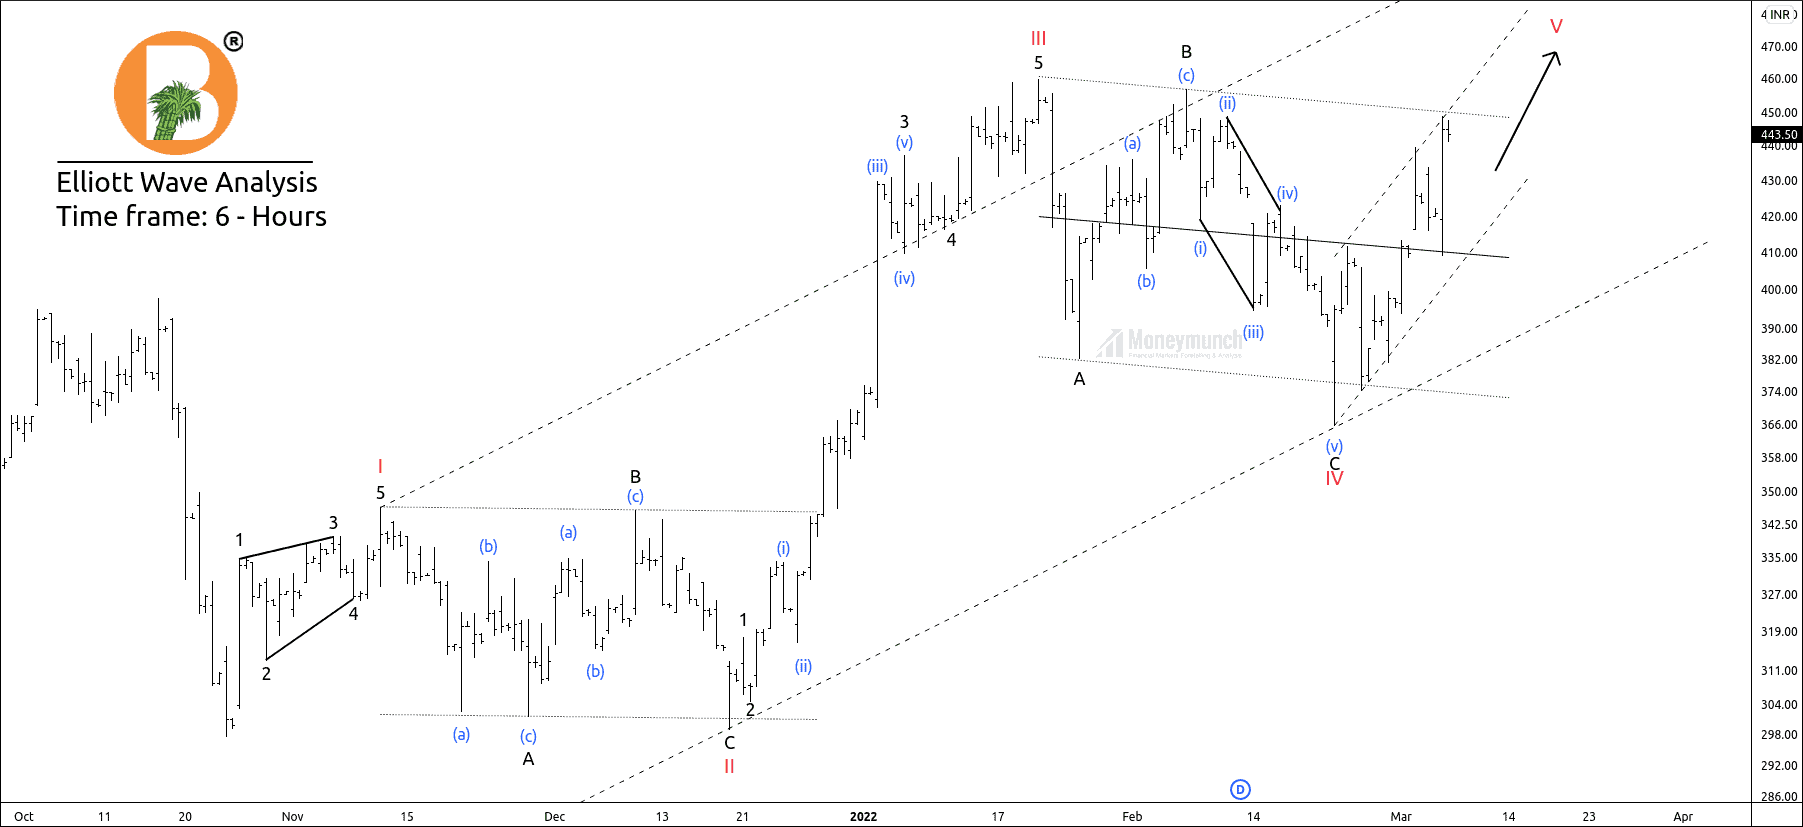
Balrampur Chini has occurred the corrective wave c of wave IV, and the price was at the top of the descending channel.
Also, the price has started forming sub-waves of impulsive wave V, which was a signal for a new all-time high.
I had written in clear words,” we can expect the following targets: 460 – 476 – 489+ for wave V.”
 AFTER
AFTER
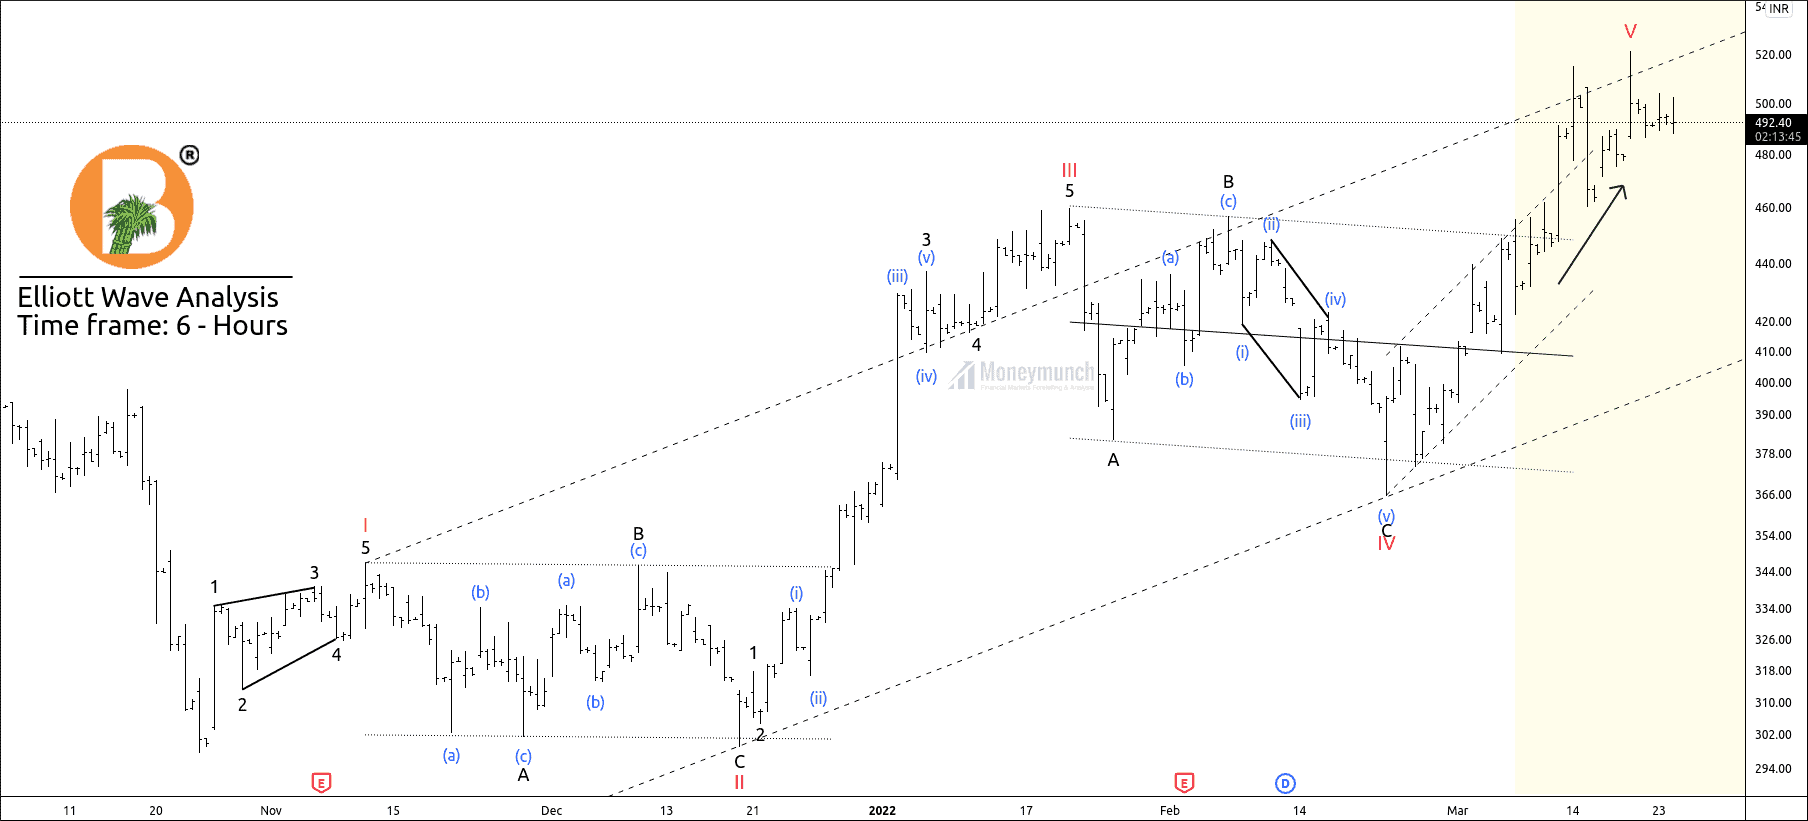
Price has broken down wave B of wave iv and started its impulsive move.

- 10 March
- Price reached the first target of 460.
- 11 March
- [2:20 PM] – Price touched the second target of 476.
- [2:25 PM] – Price hit the final target of 489. All-time high of 521.
To become a subscriber, subscribe to our free newsletter services. Our service is free for all.
Continue reading

 Unlock This Article