MCX Crude Oil & NYMEX Brent Oil In-depth Analysis & Tips

NYMEX Brent Oil Futures – Simple Trading Strategy

free commodity nymex brent crudeoil tips & daily chart

Here, I have used MA, RSI, VOL, & DMI to identify the next move of Brent Oil. According to these indicators, it seems bullish ahead. We may see the following targets soon: $68.8 – $69.8 – $71+

But, if brent oil breaks the hurdle ($66.60) and shows a closing price below it, we will see a heavy downfall. Targets: $64.6 – $62.8 and below

What about MCX Crude oil? It looks downward for a short period. Look at the below chart:

free mcx crude oil tips chart

MCX Crude oil can go down for a retracement value of 0.236 in the upcoming days. So, intraday traders can set the following targets to make some money: 4560 – 4500 – 4460 – 4400

But, if brent oil breaks $66.60 upside, then change your position for the following targets: 4800 – 4880+ To become a subscriber, subscribe to our free newsletter services. Our service is free for all.

Continue reading

USD/JPY Turning Down

free forex usdjpy chart tips

USDJPY prices are falling since the mid-2015 year. In the 2020 year, it has made a low price of $101.180. Are you still expecting up moves for the short-term? Then wait for the breakout of USDJPY-Bull Resistance.

According to my Parallel Channel (B), short positions in the range of $106 to $106.5 or below with targets at $105 – $104.5 – $104.260 in extension.

Breakdown of Parallel Channel (B) means a big explosion and double confirmation for sellers. Day traders can take benefit easily by examining fake-out…

Continue reading

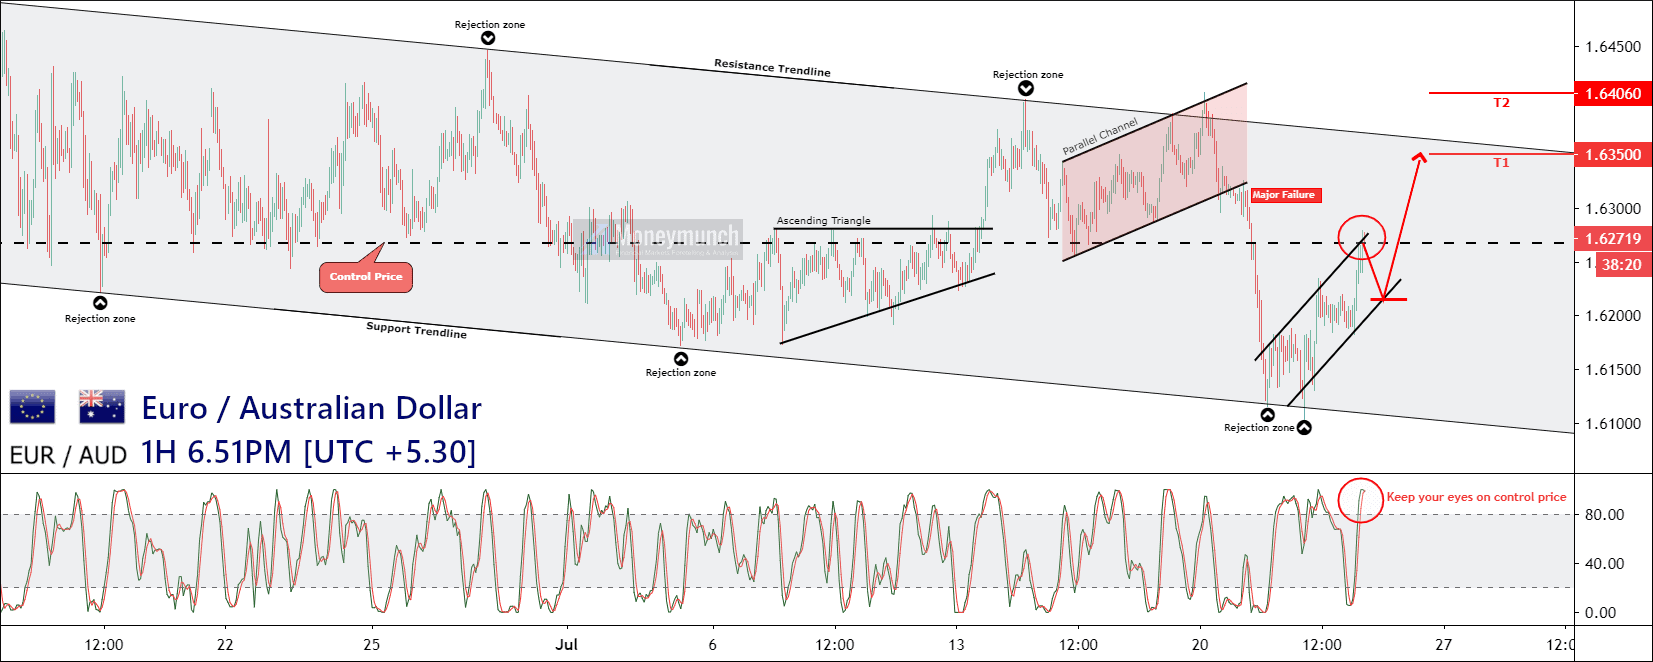
The Big Move In EURAUD May Be Right Now

free forex euraud tips chart

EURAUD price begins to accelerate higher faster than other currencies from the control price (CP). It can hit 1.63500 – 1.64060 after crossing the CP level.

Hurdle: 1.62150

This hurdle is a game-changer. It could explode downward and prices may fall 1.61850 to 1.61360 levels.

The above information is sufficient for a smart trader to start minting money.
Continue reading

USDCHF Trend Analysis & Forecasts

free forex usdchf tips chart

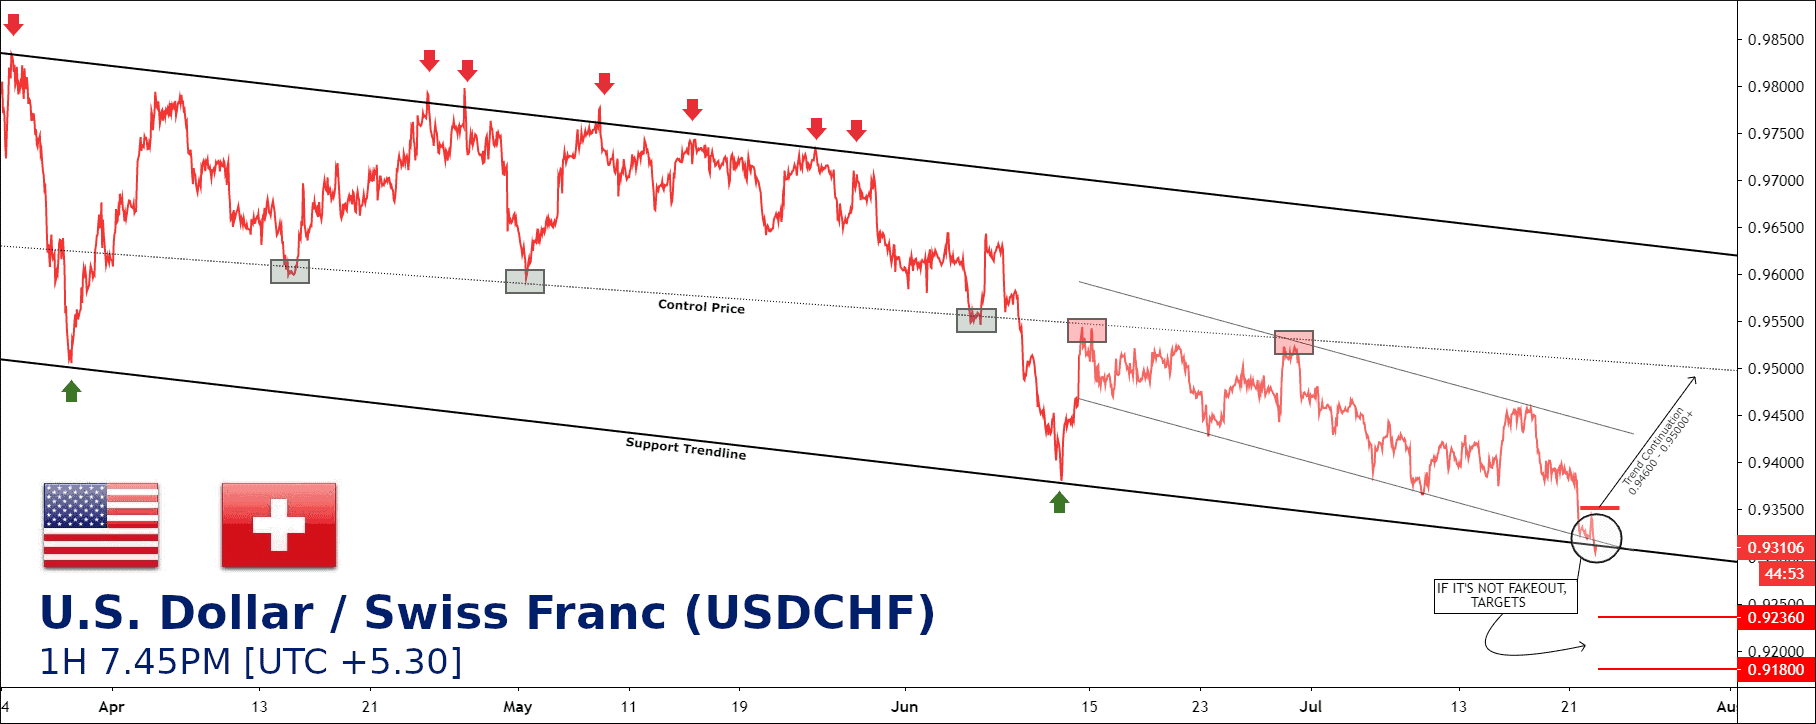
As per this chart, the trend continuation will drag up to 9.94600 – 0.95000 levels.

Keep your eyes on the support trend line, USDCHF has broken it. If it’s not fake-out, 0.92360 – 0.91800 target levels.

Continue reading