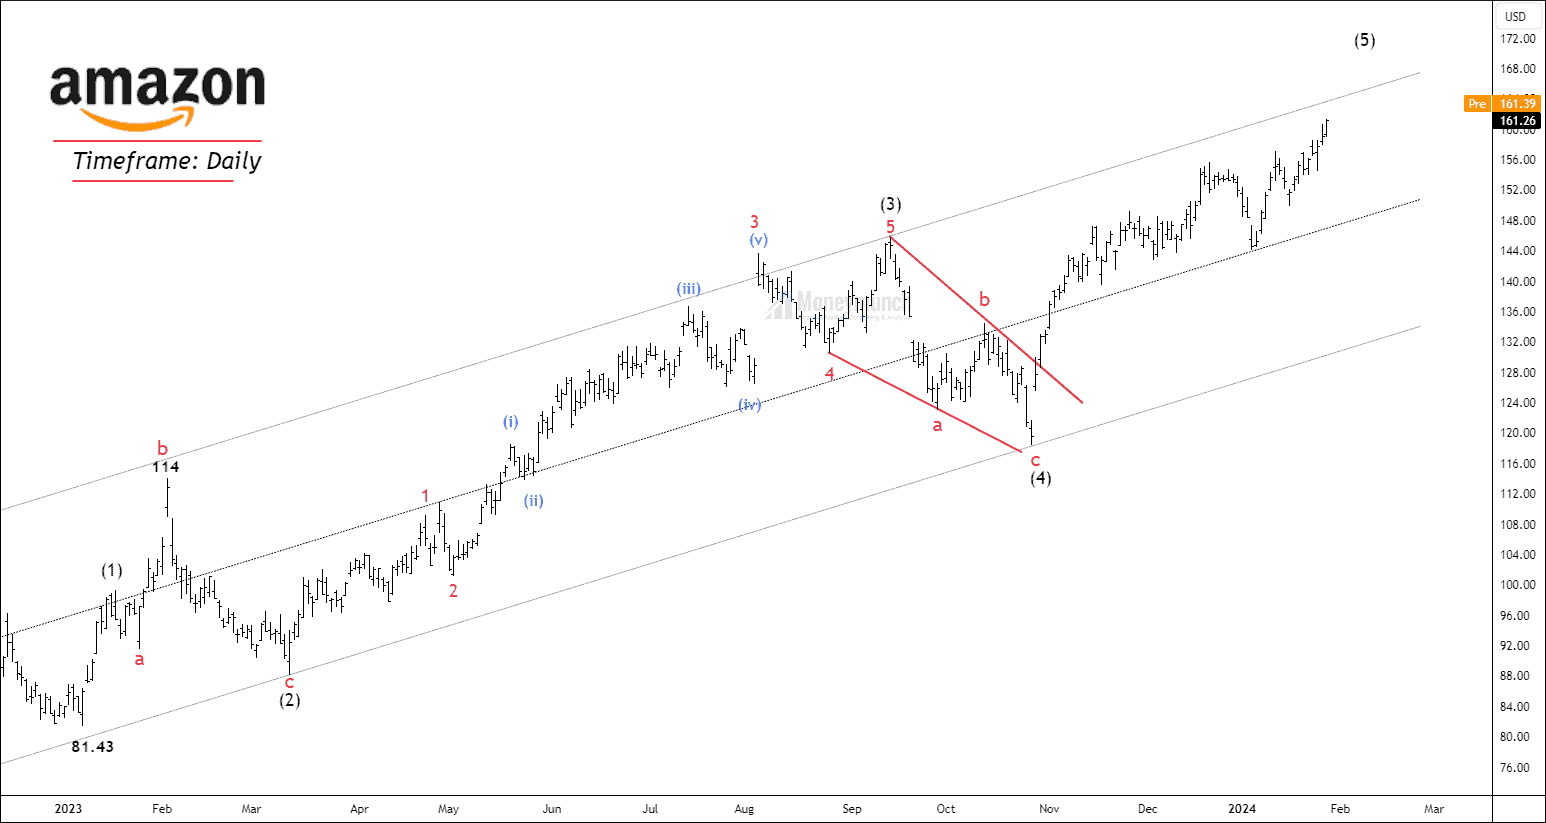
USDINR, USDCAD & EURUSD INDEX – Trading Signals

free-forex-usdinr-tips

Upside Risk for USDINR in 2018

Support Trendline Channel 1 (2012 – 2017): A Solid Uptrend – It had been broken on May End

Support Trendline Channel 2 (2011 – 2018): Trying to Resume The Uptrend of STC 1

All Top Levels are Working as Strong Resistance. STC 2 is failed to hold uptrend as per Elliot Wave Signal.

As per EW, the upcoming target is 67.464 – 66.254 – 65.897 – 63.717 levels.

Caution: Top breakout can make this pair unstoppable upside. That’s why I named Strom’s Initiator on the above chart. We may see these levels: 69.450 – 70.291.

To become a subscriber, subscribe to our free newsletter services. Our service is free for all.

USDCAD NEED CORRECTION?

On USDCAD Index, 50% Correction awaiting ahead because it had overbought in the previous week.

The Technical Indicator STOCH (14, 14, 3, 3) is indicating sell signal on U.S. Dollar / Canadian Dollar pair. FX Traders could take profit at 1.31954 – 1.30478 – 1.29520 levels.

Its price can hike if USD CAD index crossover or close above the resistance level (1.34378), you can see the 1.35500 – 1.37788 levels.

Continue reading

Update: Hurry! Earn 300+ pips on GBPUSD currency Forecast.

Before one month ago, what had I written about GBPUSD index? Click here and recall.

One more closing under the green zone will indicate the downtrend continuation.

If it’s not a fake out, we will see the following levels.

Targets: 1.33111 – 1.31418 – 1.30478

GBPUSD achieved two targets 1.33111 – 1.31418 levels.

GBPUSD index is very close to the next target 1.30478 level (Today’s Low : 1.31009).

Is next target soon? To become a subscriber, subscribe to our free newsletter services. Our service is free for all.

Continue reading

UPDATE 2: Indian NSE Currencies pairs USDINR and EURINR

What had I strongly recommended about USDINR @JUNE 4, 2018, 10:56 PM (IST)? click here
Technical Report of USDINR Pair

We have already recommended waiting for the crossover levels.

Bullish side rally will initiate after the crossover of 67.186 level. It will over after breakout of the following target: 67.492 – 67.852 – 68.105 levels.

Solid Support: 66.818

USDINR touch all the targets: 67.492 – 67.852 – 68.105 levels.

To become a subscriber, subscribe to our free newsletter services. Our service is free for all.

As per the previous chart analysis, USDCHF will start its journey and achieved 0.99609 level.

What had I written about the EURINR index in the previous report? First, click here

Strong Resistance: 79.0064


But don’t sell after the breakout of the resistance level. Why? Because of technical indicators are indicating a solid uptrend after this level breakout. It can be up to 80.1007 level.

*Events : India Nikkei Services Purchasing Managers Index (PMI)

On yesterday, EURINR has made high 80.1855. It means, EURINR hit our target 80.1007 level.

Continue reading

Earn pips without swap on USDCHF index.

usdchf chart analysis

USDCHF chart analysis for smart traders, find your position in the chart and trade safe.

To become a subscriber, subscribe to our free newsletter services. Our service is free for all.
Continue reading

UPDATE : Indian NSE Currencies pairs USDINR & EURINR

Note:Indian NSE Currencies pairs Report click here.
EURINR index is very close to the target and USDINR index’s two targets has come. What’s next?

usdinr-moneymunch-1-16-14

What had I said for USDINR index? Click here.

I had Strongly recommended,

Technical Report of USDINR Pair

We have already recommended waiting for the crossover levels.

Bullish side rally will initiate after the crossover of 67.186 level. It will over after breakout of the following target: 67.492 – 67.852 – 68.105 levels.

Solid Support: 66.818

To become a subscriber, subscribe to our free newsletter services. Our service is free for all.


Create Alert! EURINR index is very close to the target

Strong Resistance: 79.0064

But don’t sell after the breakout of the resistance level. Why? Because of technical indicators are indicating a solid uptrend after this level breakout. It can be up to 80.1007 level.

*Events : India Nikkei Services Purchasing Managers Index (PMI)

Continue reading

Indian NSE Currencies pairs – Collapse Continuation?

Technical Report of USDINR Pair

We have already recommended waiting for the crossover levels.

Bullish side rally will initiate after the crossover of 67.186 level. It will over after breakout of the following target: 67.492 – 67.852 – 68.105 levels.

Solid Support: 66.818

Support breakout means downtrend up to 66.674 – 66.444 – 66.204 levels.

GBPINR FORECAST

GBPINR – Bearish Breakout

This pair price will drop in upcoming days. As per the technical analysis, it’s weakening.

Target: 88.927 – 88.361 – 88.046 level.

Stop Loss is available for subscribers. To become a subscriber, subscribe to our free newsletter services. Our service is free for all.

EURINR is not bullish anymore!

Strong Resistance: 79.0064

Selling pressure will increase soon. It’s very close to the resistance level. It can be dropped up to 77.8244 – 77.2010 – 76.6865 levels.

But don’t sell after the breakout of the resistance level. Why? Because of technical indicators are indicating a solid uptrend after this level breakout. It can be up to 80.1007 level.

*Events : India Nikkei Services Purchasing Managers Index (PMI)

Continue reading