Free Forex tips, FREE Stock, Commodity & Forex tips, Global market

SPX – A Peculiar Reversal Or Straight Continuation

Free s&p chart calls

Free s&p chart calls

Timeframe: 4h

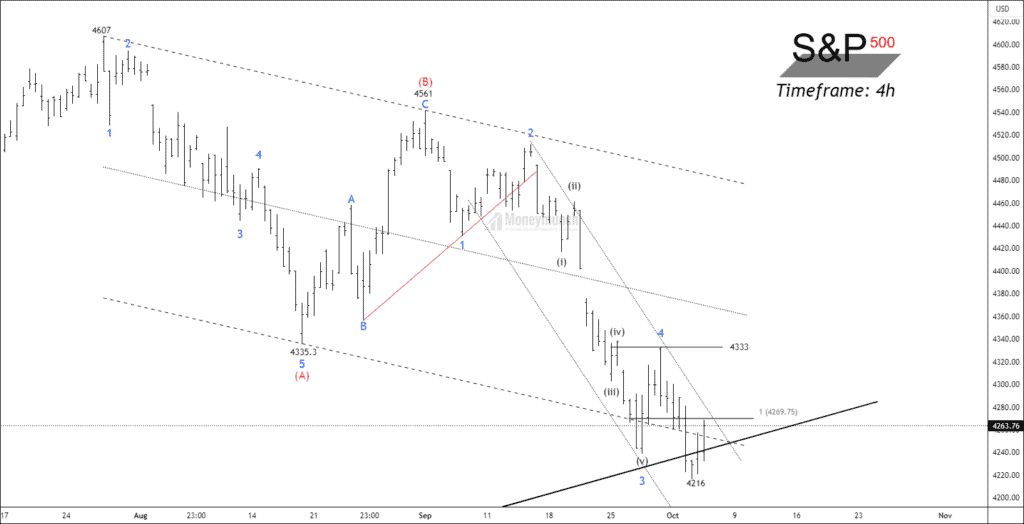
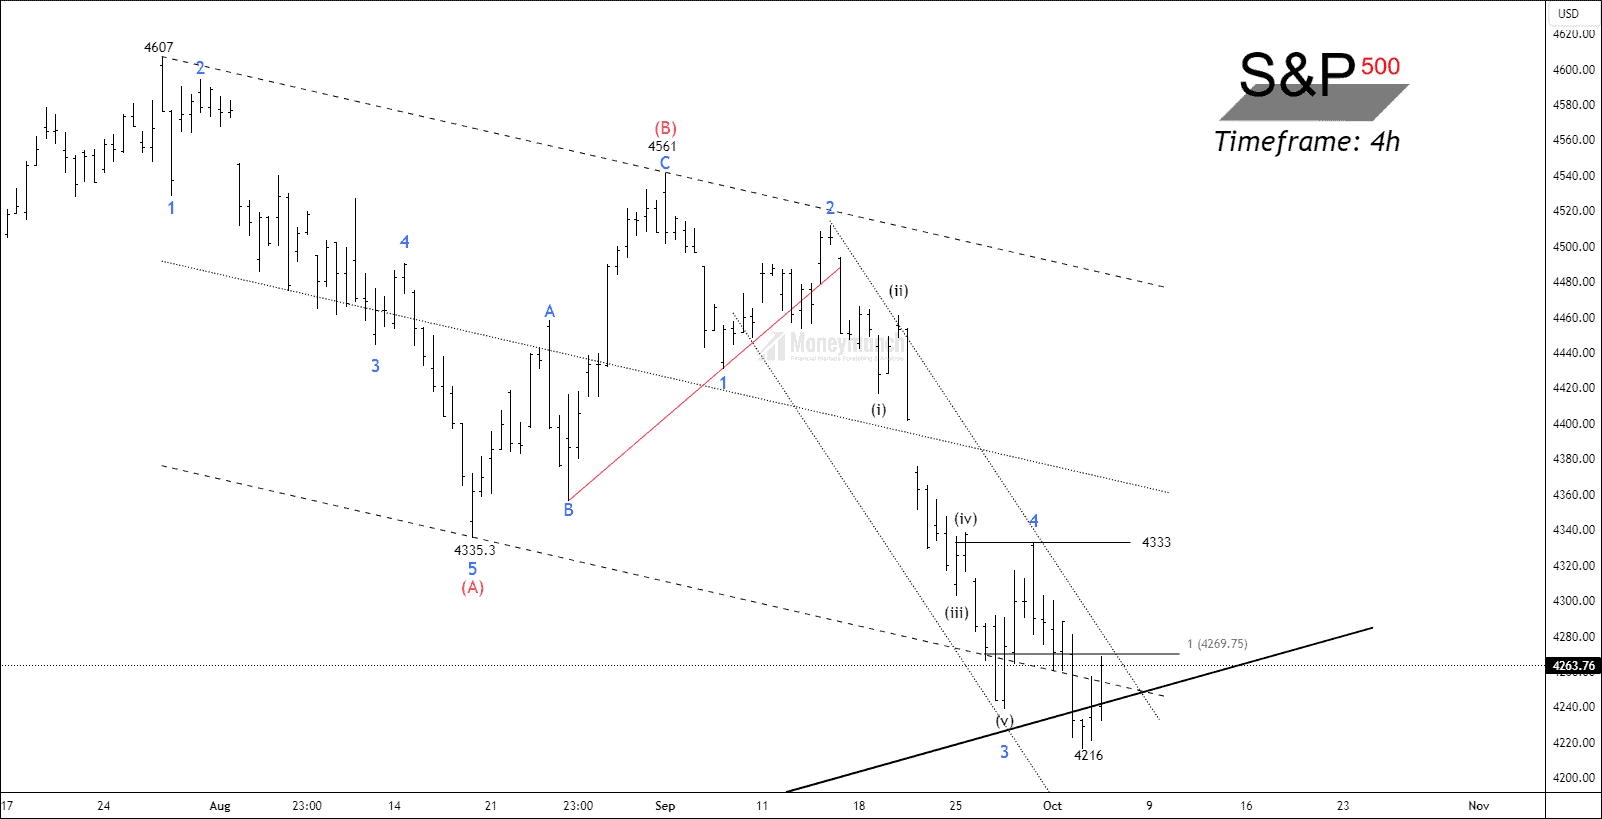
SPX has formed a corrective A-B-C zigzag formation on the hourly timeframe chart. The price has accomplished wave (b) at 4561, creating the final wave C of the corrective wave (c). SPX has occurred sub-wave 4 at 4333 and started forming sub-wave (5) of wave (C).

According to the Elliott wave principle, an impulsive cycle can only start after the breakout of the sub-wave (4). SPX has taken third support on the dynamic support line. Another clue could be the descending channel of subwave 2-4, and the breakout able to reach wave (B). If the price breakout wave sub-wave 4 of wave (C) at 4333, traders can trade for the following targets: 4416 – 4486 – 4540+.

We can see that the mid-term trendline is holding the price movement, and failure to sustain above the dynamic support can lead to worse conditions even if the price has retraced 61.8% of the overall move. Moving averages are trading above the price, and a rising RSI shows the strenth is about to come.

Premium subscribers will get trade setup with entry, exit, and invalidation levels.

Get free important share market ideas on stocks & nifty tips chart setups, analysis for the upcoming session, and more by joining the below link: Stock Tips

Have you any questions/feedback about this article? Please leave your queries in the comment box for answers.

Disclaimer: The information provided on this website, including but not limited to stock, commodity, and forex trading tips, technical analysis, and research reports, is solely for educational and informational purposes. It should not be considered as financial advice or a recommendation to engage in any trading activity. Trading in stocks, commodities, and forex involves substantial risks, and you should carefully consider your financial situation and consult with a professional advisor before making any trading decisions. Moneymunch.com and its authors do not guarantee the accuracy, completeness, or reliability of the information provided, and shall not be held responsible for any losses or damages incurred as a result of using or relying on such information. Trading in the financial markets is subject to market risks, and past performance is not indicative of future results. By accessing and using this website, you acknowledge and agree to the terms of this disclaimer.
Previous ArticleNext Article
Mr.Guru(s) is a team of stock market certified technical and research analysts with over 20 years of experience. They are regular guests on popular online channels and contribute articles to several financial publications. Their insights and advice are respected by investors worldwide. With their collective knowledge and expertise, they have a proven track record of successfully predicting market movements and identifying profitable opportunities.

Join Today (Free): Stock & Nifty Tips

2 Comments

Write a Comment

Comment Policy: We love comments and appreciate the time that readers spend to share ideas and give feedback. However, all comments are manually moderated and those deemed to be spam or solely promotional will be deleted. Your email address will not be published. Required fields are marked *