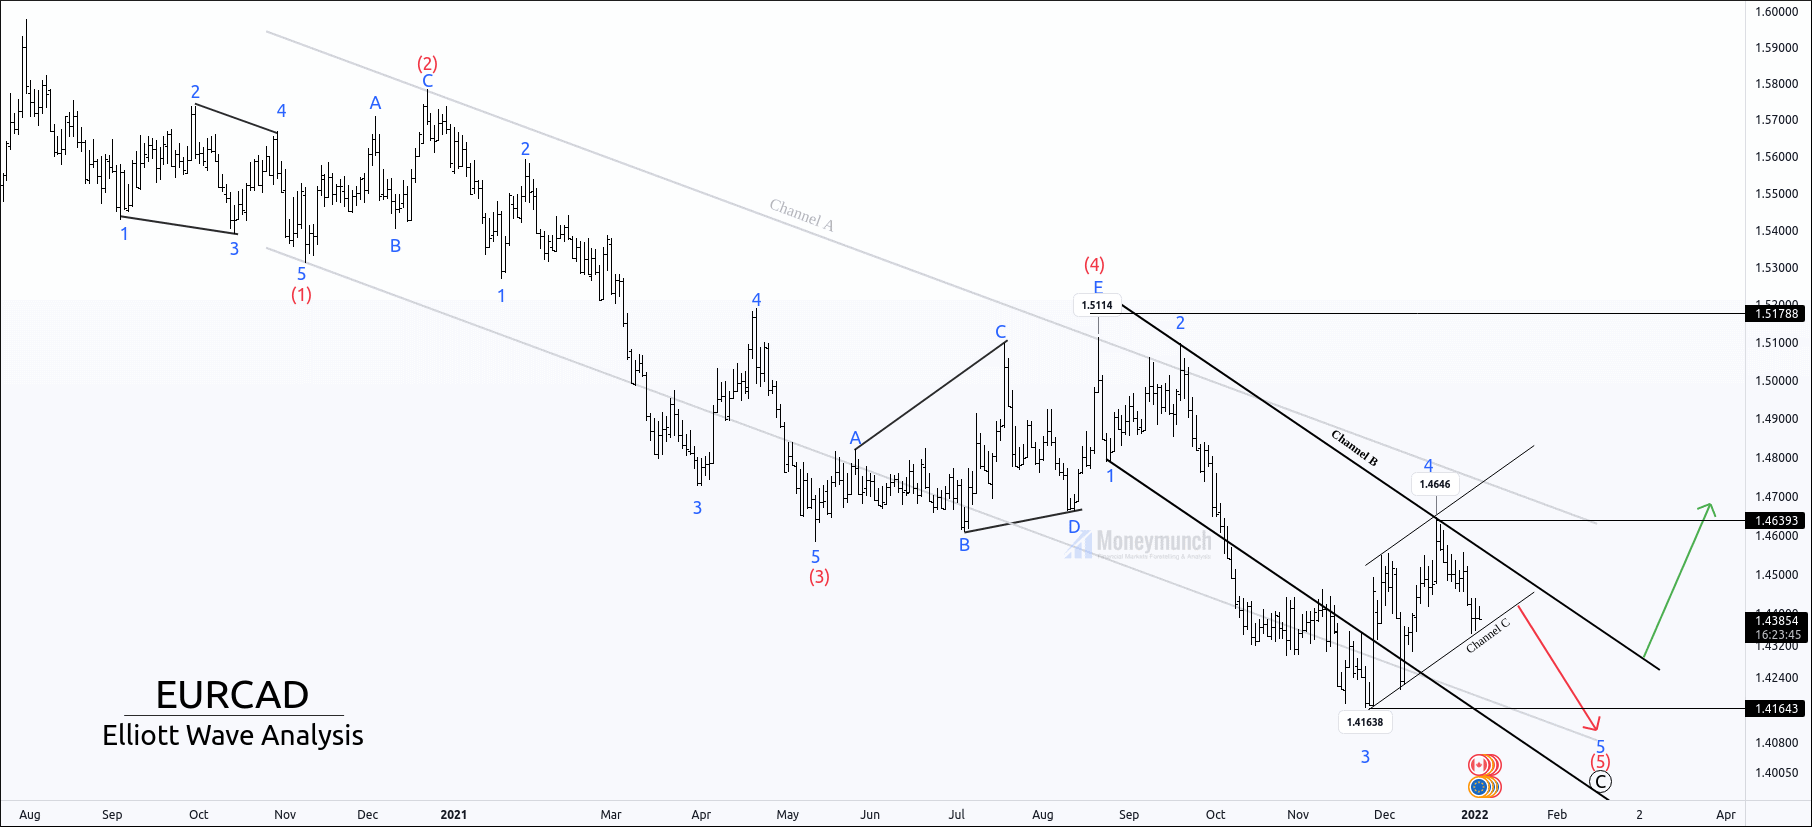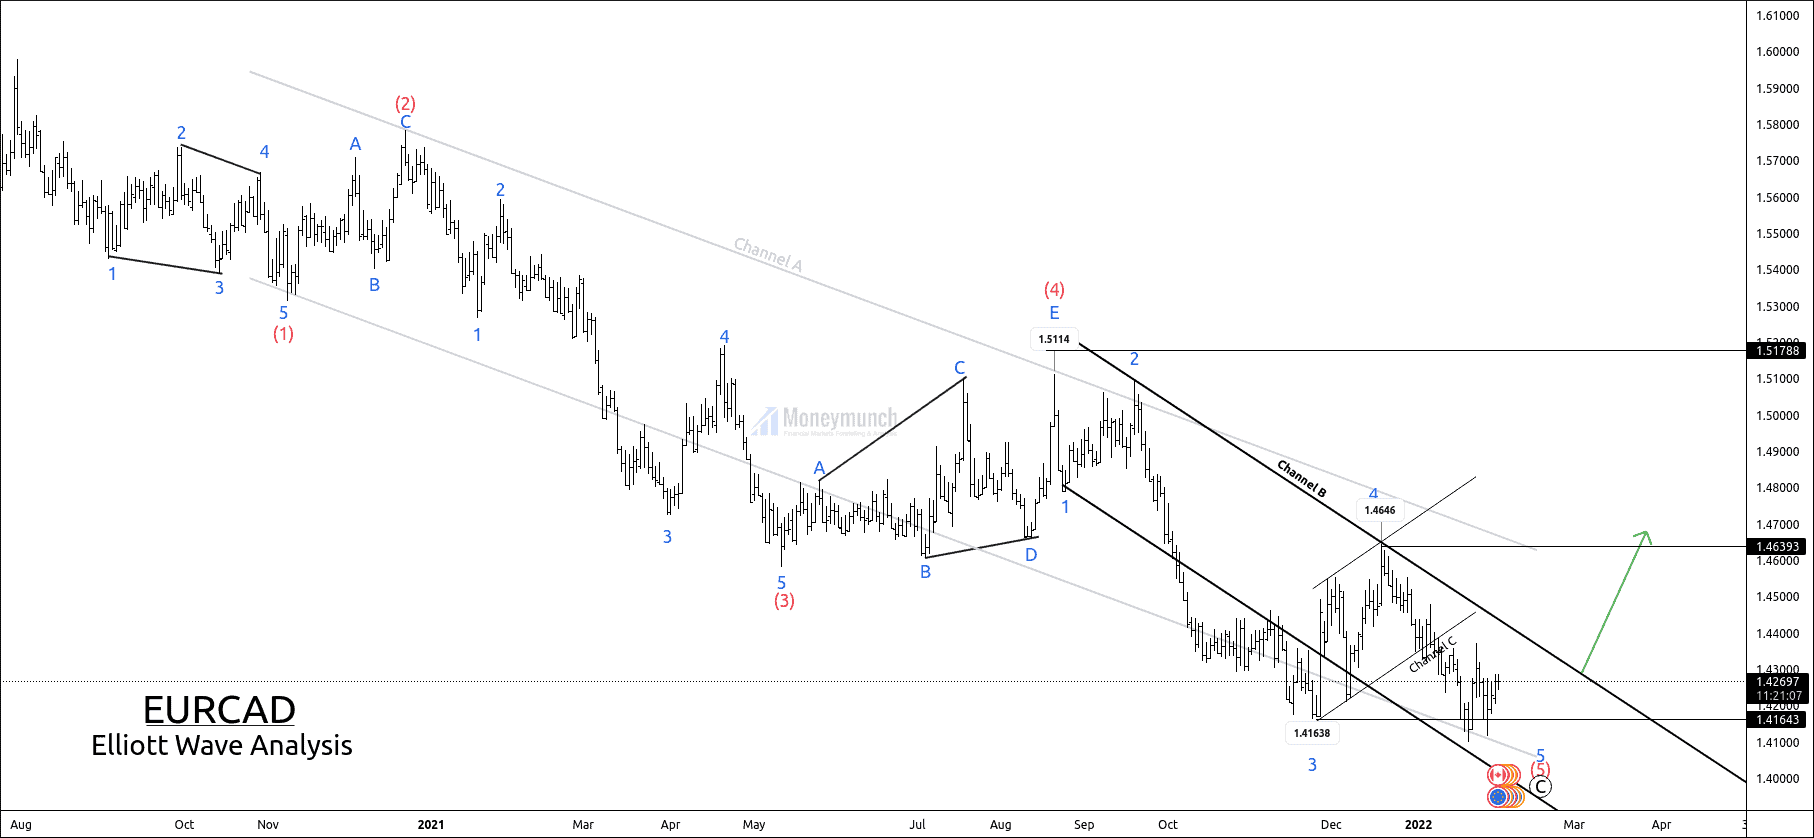
EURCAD is forming a downtrend channel.
Price is establishing a final sub-wave 5 of wave (5).
In my previous idea, I have mentioned that, If the price breaks down channel C, the following targets for Wave 5 will be 1.4313 – 1.42520 – 1.41652- 1.41156.
Price reached all the targets of wave (5).
Click Here to Read previous article.
Currently, the price is heaving correction, but safe traders can enter after the breakout of the C channel.
After making wave (5), if the price breaks the B channel, it can go for 1.4377 – 1.4466 – 1.4569 – 1.4645+. And Price will start a new 5-wave impulse structure. Invalidation is available for premium subscribers.
Please note that without a breakout, trend changes may not be possible.
 Unlock This Article
Get free forex & currency ideas, chart setups, and analysis for the upcoming session: Forex Signals →
Want to get premium trading alerts on GBPUSD, EURUSD, USDINR, XAUUSD, etc., and unlimited access to Moneymunch? Join today and start potentially multiplying your net worth: Premium Forex Signals
Premium features: daily updates, full access to the Moneymunch #1 Rank List, Research Reports, Premium screens, and much more. You΄ll quickly identify which commodities to buy, which to sell, and target today΄s hottest industries.
Have you any questions/feedback about this article? Please leave your queries in the comment box for answers.