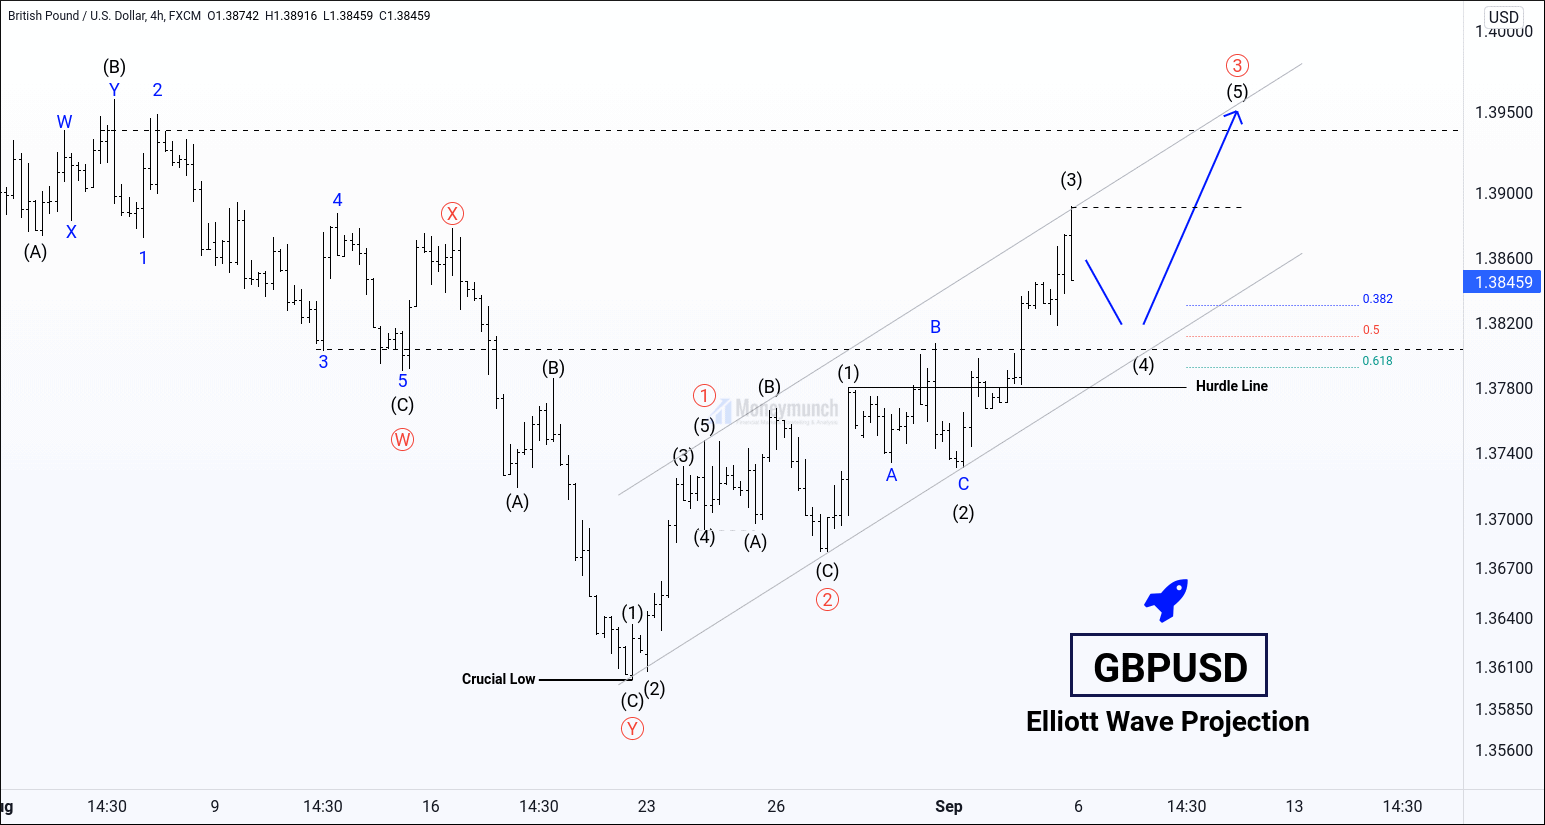
Gold will come back to the $1800 level?
On 16 July, gold has crashed over $60 during the FOMC event. At that time, Commodity Futures Trading Commission (CFTC) data was highlighting selling pressure.

And on 27 July, CFTC data was said OI (Open Interest) of a gold future contract is 500,187 and total shorts 481,533 & buys 452,107. But, gold prices increased.
We have to notice that the bullish rally wasn’t powerful compare to the 16 July data. And selling pressure has higher compare to buyers. Hence, gold has moved bearish side in the last trading session.
If gold wants to move upside, then it has to crossover my strong resistance. That will lead the gold’s prices above 1840 – 1860 – 1882 – 1900.
But if you focus fundamentally & CFTC data, XAUUSD will keep falling and touch the following targets: 1800 – 1793.6 – 1783.6 – 1763.6. Gold is making double top formation also.
Part 2: What Drives Gold (XAUUSD) Prices?
Previous Article:
XAUUSD (Gold Spot) & MCX Gold Will Skyrocket?
What’s Next:
Key levels: 1793.6 and 1783.6
According to my previous newsletter, my gold key levels will remain the same. It’s not sellable until breakout the 1766 (strong support).
In XAUUSD, buying pressures are increasing. We may see 1812 – 1824 – 1836+ levels.
Alternatively, gold is taking a reversal from the first key level, so its upside rally may be weak. But, day traders can play between my range. And stop buying when it breaks the first key level. That could drag down the gold price directly at the second key level (1783.6).
And gold’s closing price below 1783.6 means blast. It may hit the strong support level directly.
Please note, don’t forget to watch significant releases or events mentioned above in the chart that may affect the movement of gold, silver, and crude oil.
USD/JPY May Continue Decline
USD/JPY has made a high of 111.66 and took a U-turn. Its impulsive wave breaks at support trendline breakout. It can keep falling from the dynamic resistance trendline (DRT). We may see 109.54 – 109.15 – 107.48 soon. Don’t sell after a breakout of DRT or 110.7 level. And do not forget to watch significant releases or events mentioned on the above chart that may affect the movement of USD/JPY.Continue readingTechanical Analysis of USD/JPY
According to the 4H chart of USD/JPY, its uptrend can extend and touch the following target prices: 111.11 – 111.50 Invalidation: prices below ii or 50 MA.Continue readingWill Gold Spot Decline More? (TP 1682.6)
In-depth analysis: Is it the right time to buy gold?
Gold (XAUUSD) and silver (XAGUSD) has crashed in the previous week. Gold has lost -113.585 points (-6.05%), and silver lost -2.14315 (-7.68%). Millions of CFD’s traders have lost money in that week.
Where’s gold’s bottom?
According to technical analysis and fundamentals research, gold can decline more. Gold has broken the strong support trendline (01) and marching for 02. If it doesn’t close above to trendline of 01 in the first two trading sessions, it will be unstoppable through high selling pressure by speculators. And we will see the target price 2.
Technically, the most popular indicators are indicating a complete downtrend. And Stoch RSI is signaling for a reversal. So, it can pull back up to a retracement level of 38.2% or 01 trendlines. If that not happen, gold can lose 81.635 points more.
In the previous week, gold and silver were falls due to economic events and high selling pressures by speculators. For advance traders, watch significant releases or events that may affect the movement of gold, silver & crude oil.
Tuesday, Jun 22, 2021
00:30 – FOMC Member Williams Speaks
01:00 – All CFTC Speculative net positions
11:00 – Gold Index
20:30 – FOMC Member Daily Speaks
23:30 – Fed Chair Powell Testifies
Wednesday, Jun 23, 2021
02:00 – API Weekly Crude Oil Stock
18:30 – FOMC Member Bowman Speaks
19:15 – Flash Manufacturing PMI | Flash Services PMI
20:00 – Crude Oil Inventories
20:30 – FOMC Member Basic Speaks
Thursday, Jun 24, 2021
18:00 – Final GDP q/q | Initial Jobless Claims


