

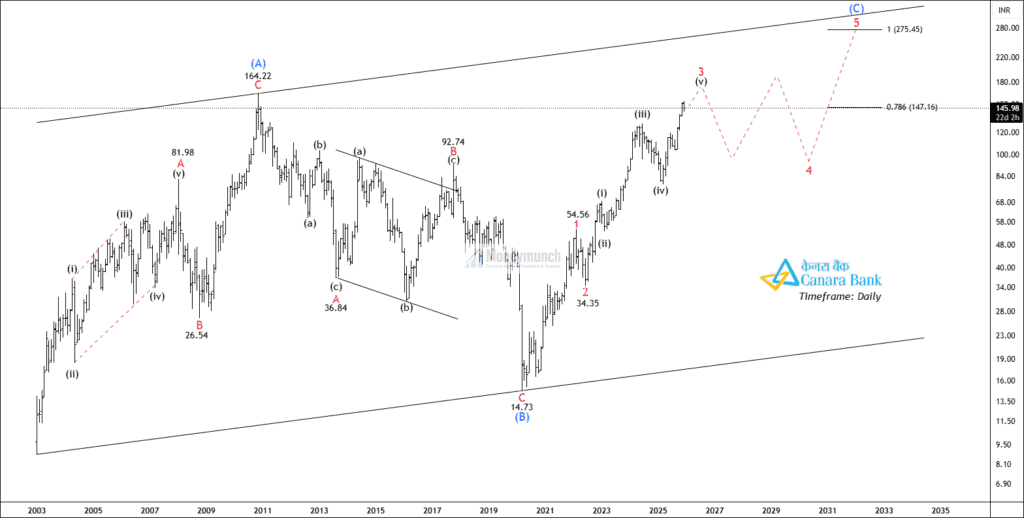

NSE CANBK has formed a corrective pattern, an A-B-C structure. Wave A accomplished at 164.2 and wave B accomplished at 14.73. At this glance, price is forming wave 3 of the wave (C). Targets for the final wave 5 push are 180 – 245 – 275+.
Detailed Wave Outlook:
CANBK has been moving inside a rising long-term channel since the early 2000s, showing a strong structural uptrend. The 2020 crash found solid support near the lower end of this channel around the 15 level, confirming it as a key demand zone. The upper boundary remains unbroken, which keeps the long-term bullish structure intact. As a result, deep pullbacks are still considered corrections within the trend, not a major trend change yet.
On the monthly chart, Wave (C) is forming a clear five-wave impulsive structure. Wave (i) began with the sharp rise from the 2020 lows, followed by Wave (ii), which was a deep pullback toward the 34 zone. Wave (iii) has already played out as a strong and extended rally, making it the most powerful leg of the move. Price is now going through Wave (iv), marked by a corrective phase that is more sideways to downward in nature and does not damage the overall trend. The final leg, Wave (v), is still pending and is expected to bring the next phase of expansion.
From a big-picture Elliott Wave perspective, the chart shows a large impulsive cycle in progress. Wave (A) peaked near the 164 level, followed by a deep corrective Wave (B) during the COVID crash around 14–15. Since then, the stock has been moving higher in Wave (C). This wave is usually impulsive in nature, often matching or exceeding the length of Wave (A) and pushing price toward, or slightly beyond, the upper boundary of the long-term channel. Structurally, this places CANBK in the strongest phase of its long-term cycle.
On the monthly timeframe, price is not expected to move in a straight line and volatility should be normal. The stock may see multi-month pullbacks of around 20 – 30%, followed by sharp rallies and deep consolidations. As Wave (v) unfolds, momentum is likely to expand with wider monthly trading ranges. As long as major swing lows hold above the 90 – 100 zone and price continues to stay within the rising channel, the overall monthly uptrend remains intact.
We will update further information for premium members soon.
Get free important share market ideas on stocks & nifty tips chart setups, analysis for the upcoming session, and more by joining the below link: Stock Tips
Have you any questions/feedback about this article? Please leave your queries in the comment box for answers.

tq for this informative wave idea!
I have 1000 Qty since covid low