
Timeframe: 4h
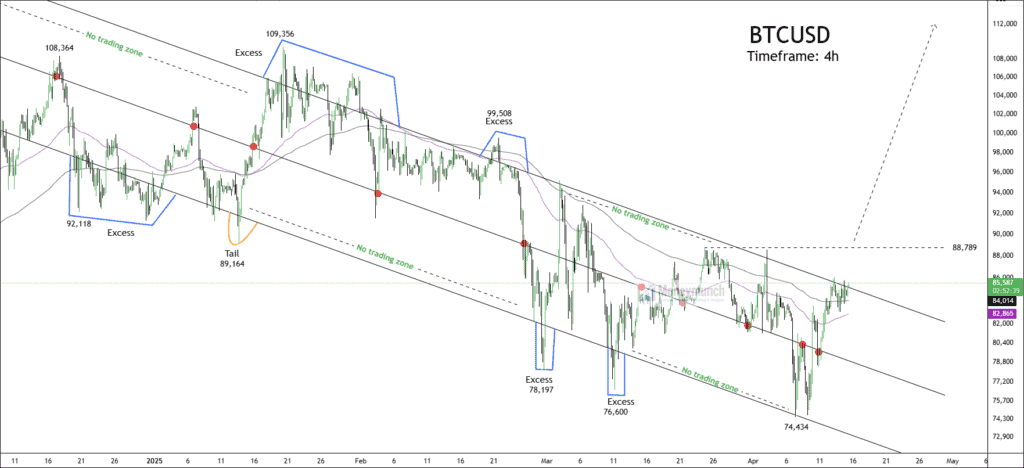
BTC is currently moving within a well-defined descending channel, staying between the upper and lower trendlines. The control line in the middle has acted like a key level, where the price has reacted several times. There have been a few fakeouts above and below the channel, especially around the 109,356 and 76,600 levels, which shows signs of liquidity grabs.
A strong tail formation around 89,164 indicates buyer strength and a quick bullish reversal. Recent price rejections at 78,197 and 76,600 again show demand picking up near support. The chart also highlights “No Trading Zones”, where the price usually doesn’t stay for long and tends to move quickly when it enters or exits them. Right now, BTC is sitting just under the control line, which could mean a breakout is close.
If BTC breaks above the control line and 88,789, it would signal a shift to a more bullish trend, with possible targets at 94,000 – 99,000 – 1,11,000+. But if it fails to break through, the price could fall back toward 80,000. A drop below 76,600 would likely bring more selling pressure and could take the price down to a new low.
We will update further information soon!
Get free forex & currency ideas, chart setups, and analysis for the upcoming session: Forex Signals →
Want to get premium trading alerts on GBPUSD, EURUSD, USDINR, XAUUSD, etc., and unlimited access to Moneymunch? Join today and start potentially multiplying your net worth: Premium Forex Signals
Premium features: daily updates, full access to the Moneymunch #1 Rank List, Research Reports, Premium screens, and much more. You΄ll quickly identify which commodities to buy, which to sell, and target today΄s hottest industries.
Have you any questions/feedback about this article? Please leave your queries in the comment box for answers.
Super helpful!