Finance Minister P Chidambaram today asked banks to gear up for the rollout of direct cash subsidy scheme to cooking gas (LPG) consumers throughout the country.
“I have asked them (bankers) to get ready for the rollout of LPG for the whole country,” Chidambaram told reporters after a meeting with senior PSU bankers here.
As a pilot project, the government has decided to give cash subsidy to LPG consumers under its ambitious Direct Benefit Transfer (DBT) scheme soon, and will cover 20 districts by May 15.
LPG consumers will get about Rs 4,000 per annum in cash from the government, and they will have to then buy LPG at market price of Rs 901.50 per 14.2-kg cylinder.
Currently, each consumer is entitled to 9 cylinders of 14.2-kg each at subsidized price of Rs 410.50. On each of this cylinder the government bears a subsidy Rs 435.
There are about 14 crore LPG consumers in the country. Regarding the second phase of DBT scheme to be launched from July in 78 districts, Chidambaram said: “They (bankers) have all said that they will be ready in the 78 districts”.
The Planning Commission would be holding meetings with the 78 district collectors.
“We have said the lead bank managers of 78 districts will also attend the meeting,” the Finance Minister said.
The government has already capped the number of subsidized cylinders at six per household per year, and beyond that a consumer has to pay the market price. However, some state governments are providing more subsidized cylinders and bearing the burden themselves.
The government expects that the DBT will eliminate all ghost LPG connections and diversion of cylinders.
In the first phase of DBT that started in January, 43 districts are being covered.
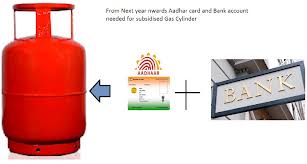
Under the DBT scheme, subsidies and other benefits are transferred directly into the Aadhaar linked bank account of the beneficiary.