“BEARS ARE CORNERED. THE REVERSAL COULD BE POSTPONED”
If the investor behavior is to buy with bad news, having the knowledge that Bankers are supporting the equity market every time there is a threat of a potential top, how can bears culminate a reversal pattern?
But…
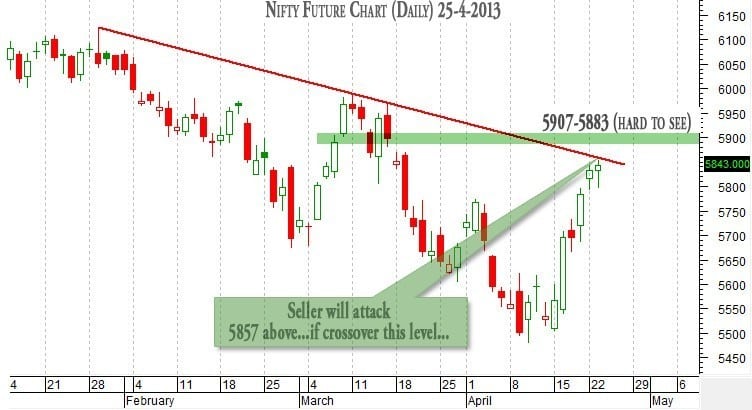
Last two Trading Secessions, We are enjoying selling at 5838-5844 and Profit booking 5800 around…,


 Unlock This Article