NIFTY Chart with 5th wave long term view

Dow and Nifty Chart

The Dow’s parabolic move higher has continued with gusto throughout November. So what’s next? Well, I think Santa is coming to the party with a Christmas rally that will be the last hurrah for this bull market that began in 2009.

Let’s begin the analysis with the weekly chart.

Dow Weekly Chart
dow-jones

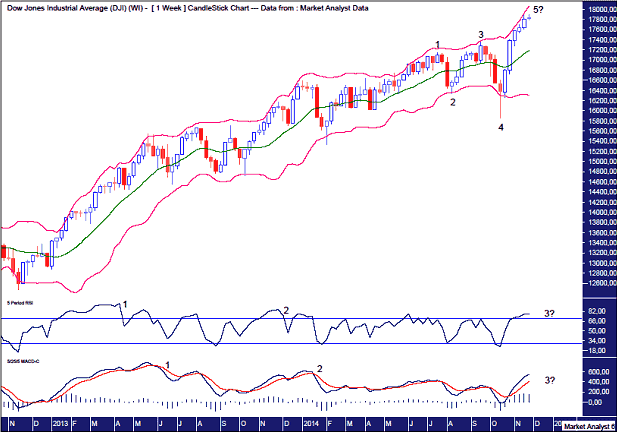
The Bollinger Bands show price clinging to the upper band as expected for a parabolic move higher. This move up still looks to have more price and time left in it.

There has hardly been any pullback of significance in the last month, which is testament to the current strength of the bulls. I thought a minor 23.6% Fibonacci correction may occur, but the bears couldn’t even manage that.

So we have a 5 point broadening top in play as denoted by the numbers 1,2,3,4 and 5. We are now just awaiting the final wave 5 high to form.

This is also a “three strikes, and you’re out” topping pattern, which consists of three consecutive higher highs.

As outlined in the November newsletter, I expect this final high to be much higher than the point 3 high, as that high was only marginally higher than the first high at point 1. That appears to be holding true here.

There also appears the potential for the coming top to be accompanied by a triple bearish divergence in both the Relative Strength Indicator (RSI) and the Moving Average Convergence Divergence (MACD) indicator. This is denoted by the numbers 1, 2 and 3 on the respective lower indicators. This is commonly found at tops and generally leads to a significant decline.

Let’s move on to the NIFTY Chart
nifty-chart

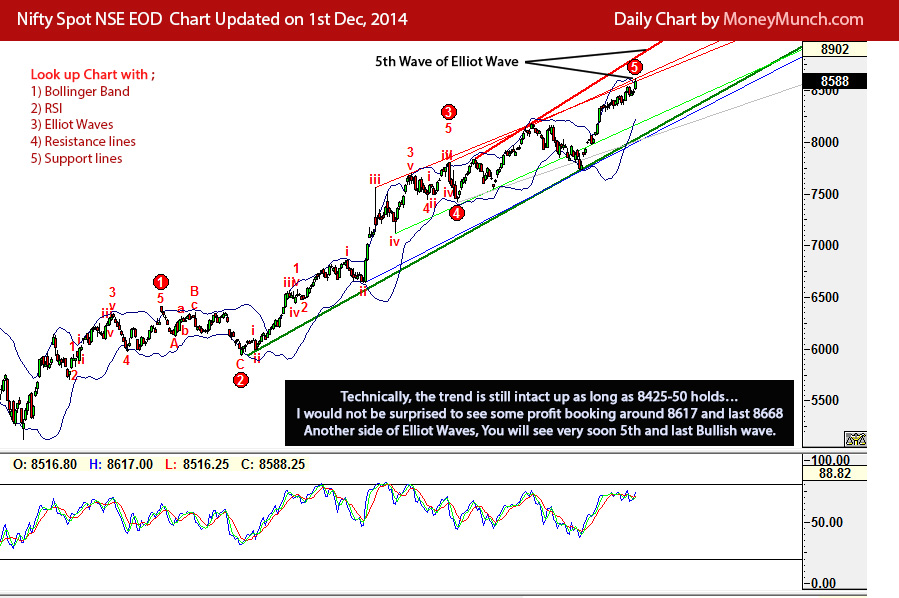
As per my personal view, Nifty will fall heavy after big up move.

MORE DETAILS for NIFTY Future will be for Subscribers live by the Yahoo Messenger.

To become a subscriber, subscribe to our free newsletter services. Our service is free for all.

Last Nifty future call by us is to buy 8455 for targets 8610 (Achieved Targets).

NIFTY setup

Continue reading

Good Morning with World Markets

money is one of the ways we can turn the dreams we have into the reality we live. Without enough money, or a true scarcity of it, life can feel miserable. But when you have money in your pocket, does everything automatically get better? I think we all know the answer.

Money can’t change who we are. All it does is magnify our true natures. If you’re mean and selfish, you have more to be mean and selfish with. If you’re grateful and loving, you have more to appreciate and give.

Take a moment and think back to the financial meltdown of 2008. Trillions of dollars of stock and home values evaporated into thin air. Millions of jobs were lost in a matter of months. What did you experience? How did it hit you? How did it affect your family? How about your friends? Some of us reacted with fear, some with anger, some with resignation, some with resolve. All these responses were not about money, but about us. These events shined a light on what money really means to us. What power we give it. Whether we let money control us, or whether we take control of it.

good-morning-world-markets

WORLD MARKETS RATE :

  • Gold trading at 1200 at 1196.
  • Us dollar index trading around 88 at 87.
  • Nymex crude trading below 70 at 69 and Crude Oil (Brent) at 75.5.
  • Dow future trading with flat closing at 17,805.00 with -7.50 points negative.
  • Green global trend seen.
  • Indian Market can be move 6000 above very soon.
Continue reading

Commodity Crude oil, Aluminum, CPO & Cardamom tips

mcx ncdex crude oil

MCX Crude oil intraday tips

Yesterday, crude oil made a new low and closed at $73.80. Today we will see upside opening bell in MCX Crude, but speculators can start selling after break 4620 level.
Intraday targets: 4592-4570
Stoploss we will provide due to market hours only our subscribers! To become a subscriber, subscribe to our free newsletter services. Our service is free for all.

MCX Aluminium

MCX Aluminium short term view

Yesterday MCX Aluminum closed 128.9 level first time after 6 years! If it not comes back below yesterday low in 2 consecutive days then we will see giant buying pressure and unpredictable upward movements.
Smart traders, here are your short term targets: 129.8 – 131.4

CPO & Cardamom Forecast

I don’t want to waste time of readers. Let’s come to the point, go and sell if open downwardly!
Intraday Targets for CPO: 441.5-440 and Cardamom: 833-826

Continue reading

FREE CNX Nifty Tips with Resistance

Free CNX Nifty Tips  and Chart;

cnx-nifty

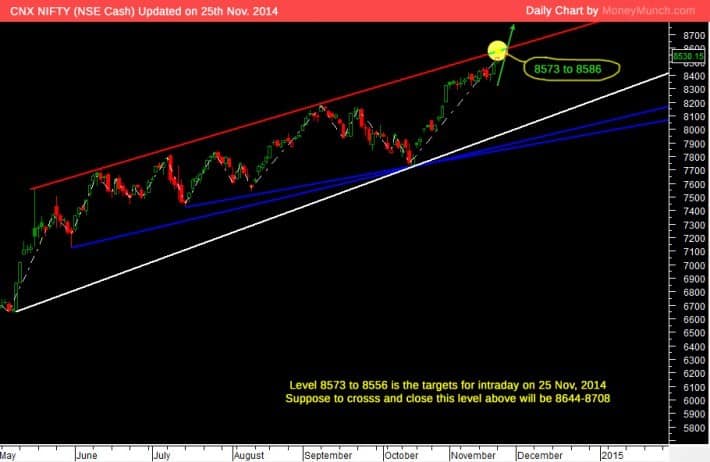
Look Up FREE CNX Nifty chart and watch 8575 above to Cash Nifty.

We have bought Nifty Future 8451 to 8466 and also SEND you Email of This call: BUY NF 8449 to 8466 wtih Stoploss 8432 for targets 8572 to 8589

MORE DETAIL WILL BE FOR SUBSCRIBERS ONLY.

  • FII money:Mint newspaper says today that FII inflows into equity and debt in 2014 will top $40 billion – the highest ever. Of this, the greater  proportion (60 percent) has gone into debt. Will these flows suddenly cease or reduce?
  • Political stability, reforms and business climate.
  • Inflation trajectory.
  • The RBI’s stellar act.

MORE About CNX NIFTY:

The CNX Nifty is a well diversified 50 stock indices, accounting for 23 sectors of the economy. It is used for a variety of purposes such as benchmarking fund portfolios, index based derivatives and index funds.

CNX Nifty is owned and managed by India Index Services and Products Ltd. (IISL).  IISL is India’s first specialism company focused upon the index as a core product.
CNX Nifty has shaped up as the largest single financial product in India, with an ecosystem comprising: exchange traded funds (onshore and offshore), exchange-traded futures and options, other index funds and OTC derivatives (mostly offshore).

Reference Source :

  1. Basics and definition of CNX NIFTY Tips on official site of NSE india.
  2.  The CNX Nifty covers 22 sectors of the Indian economy and offers investment managers exposure to the Indian market in one portfolio with Compressive about CNX Nifty.
  3. You can do Technical analysis and Research on Free CNX Nifty Tips with Live Rate and chart.

To become a subscriber, subscribe to our free newsletter services. Our service is free for all.

Continue reading

COMEX / MCX Gold and Silver charts, tips & forecast

Gold index daily chart
COMEX Gold Spot Chart & Forecast

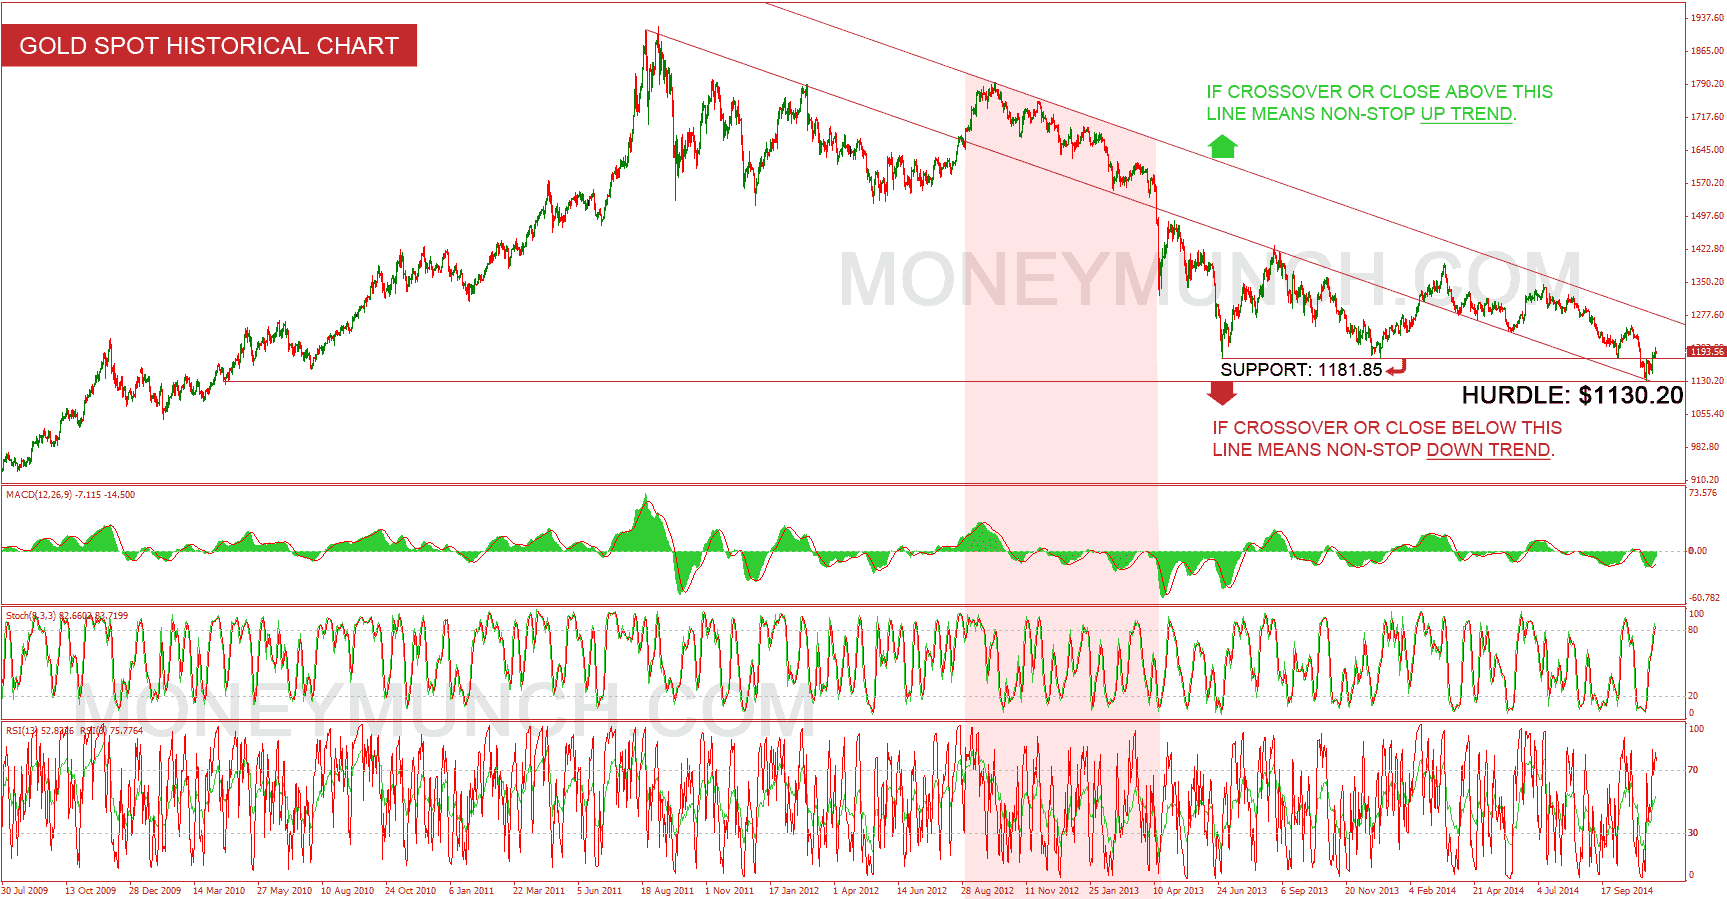
Look above COMEX Gold index chart, you can find reason easily why Indian gold is moving downwardly. I draw two important angle lines in chart to show you what happen if it crosses or close above / below the lines, and it’s just about future.

Very important thing, few weeks back gold spot was broken almost 1 year support $1181.85 and start running up, so we can expect we’ll see $1130.2 level again, but it happens if break again my support.

mcx gold daily chart
MCX Gold 4 year chart & tips

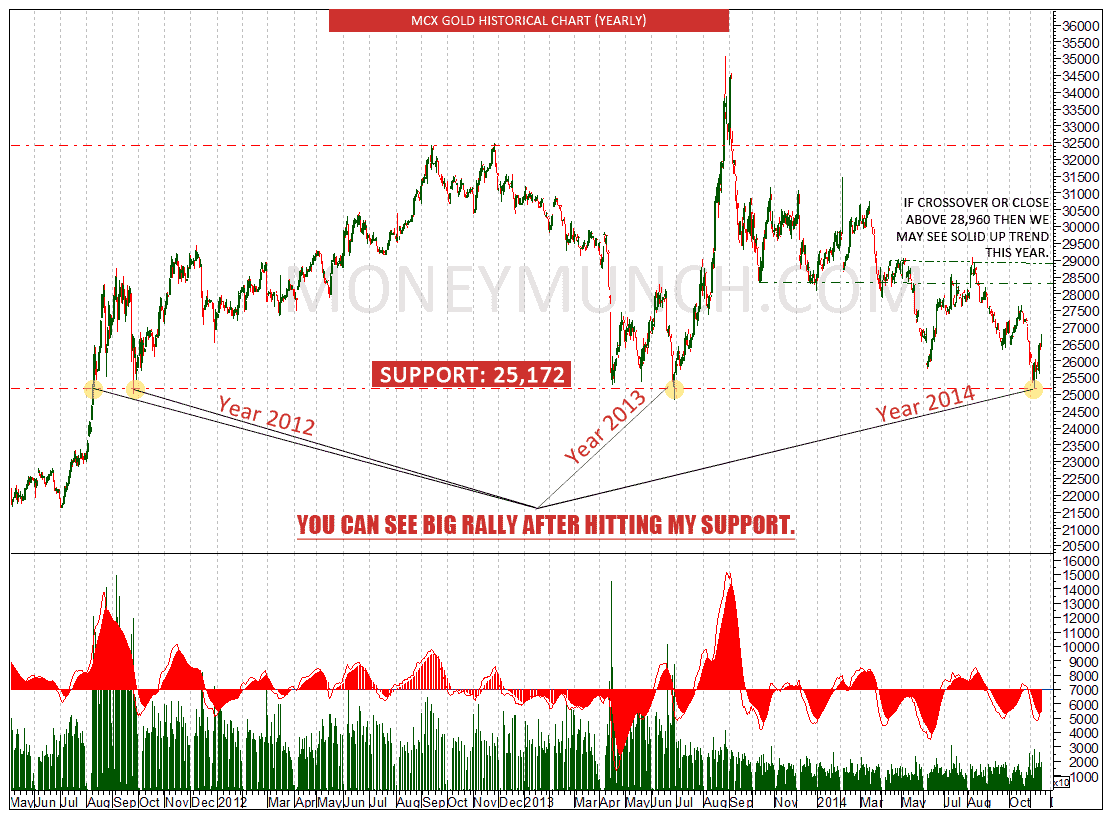
On above MCX Gold chart you can see 4 yellow circles and it’s highlighting what happen whenever gold touch support level 25,172. Now it’s clear gold will move up madly and touch 28000 – 29000 – 30000 bla bla bla but…but…but after some unbelievable down move. Wait and watch, it will show you 25500 – 26000 level soon!

MCX Silver chart tips
MCX Silver 4 year chart & tips

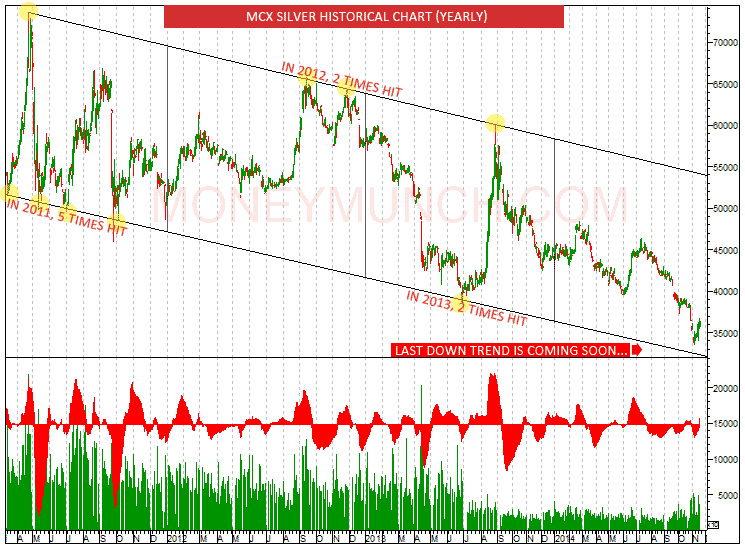
Look at above chart in yellow circles, from 2011 every year silver is hitting my two angle line minimum 2 times but in 2014 year silver playing between that lines so now you should have question when it will hit that lines? And when the last downtrend will come? Sorry but I will explain and say silver keys / secrets to subscriber and if you’re a subscriber then login to view full reports of silver.

To become a subscriber, subscribe to our free newsletter services. Our service is free for all.

Continue reading

Forex GBP, JPY & USD vs. INR Tips

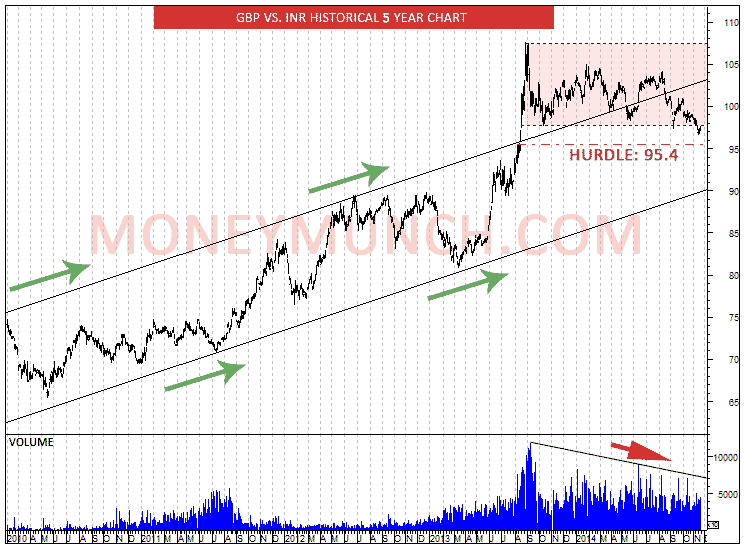
GBP vs INR chart
Forex GBP vs INR tips

JPY vs INR tips
Japanese yen vs. Indian Rupees

JPY vs. INR is totally weak and currency traders for very good opportunity. Go and sell it without any worry.
Short term target: 51.9

USD vs INR tips
United State Dollar vs. Indian Rupee forecast

USD vs. INR forex pair is looking weak and in this upcoming 1 week it will hit 61.6 level.
Short term traders for Hurdle: 62.2 level

Continue reading