My last newsletter was on MCX Crude oil, Natural gas, Aluminum and Cotton (CLICK ME TO READ IT AGAIN). Almost every commodity fired @ same day. First, let me start with Crude oil!
As I was said, crude oil run between 5639-5580 and my recommendation was if close 5580 level below for 1-2 consecutive days then it will start to move downward and if close above 5642 level then little uptrend. Same advice for this week!
I was updated Natural gas chart for intraday tips and written targets: 235 – 233 – 230.5when it was running 238. @ same day NG hit first target and on next trading session, natural gas touched second target 233 with low 232.6. What else you traders want?
Now what will happen? Will it kiss my third target 230.5 or not? For to know it, subscribe our commodity service!
What to do with aluminium, I had written on last Friday. As I expected, it closed below 118.4 level yesterday. From to today, you will look free fall upto 115.5. Check our newsletter again for to know intraday targets! Click Here to get Aluminium free tips
What I said about cotton? Click here to read it again… I was said, “Intraday traders can create, 17220 level as target for day trading!” @ same day, it made low 17160 and closed 17200. By means, our direct target touched without any interruption!
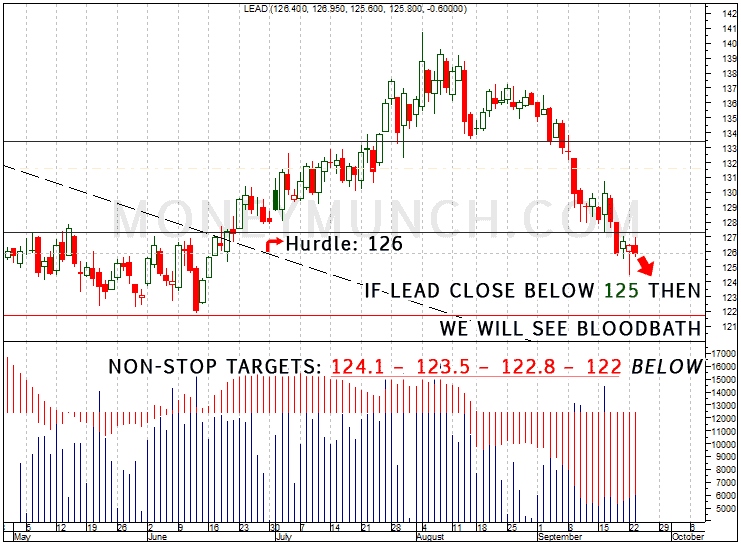
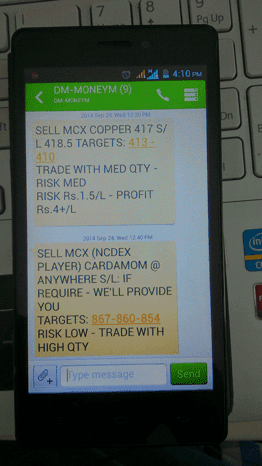
Sell sell sell… Sell on top and hold for short term Unlimited Targets: 412 – 410.5 – 408.5 – 407 below Hurdle:421 More information, I will update due to market hours for subscriber only!
No mixed opinion – No confusion – Direct decision! Sell on top, targets: 867-860-854
NCDEX Players, keep your eyes on castor seed. Our targets: 4473 – 4509 If you keep position in low, then it will be helpful to generate 1 week pocket money for you. To become a subscriber, subscribe to our free newsletter services. Our service is free for all.
The Indian stock market continues its march higher with no serious breakdown in price. But a significant decline can’t be too far away now. Perhaps this is the final rally – the encore rally. Let’s investigate.
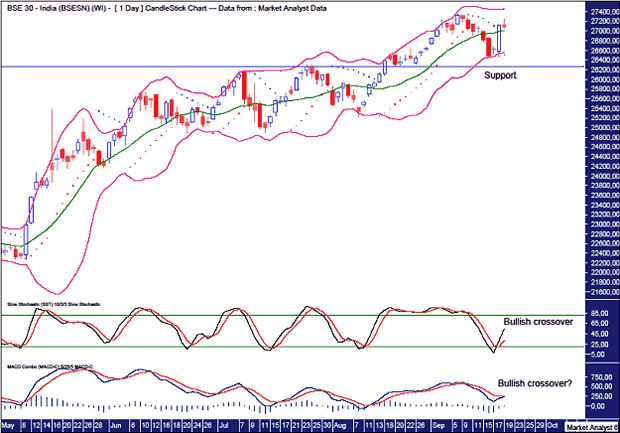
We can see price recently came down but surged higher again towards the end of last week. So, we have yet another higher swing low in place with no damage to the bull trend in progress.
I have drawn a horizontal line, labelled Support, at the previous swing low in August. This support level is also where price topped out in July. Old tops often provide support in the future. Breaking down through this level would look bearish.
The Bollinger Bands show price moving away from the upper band at the start of this month and finding support at the lower band. The bounce off this lower band looks bullish. Price is already back to the middle band with the upper band in its sights.
I have added a Parabolic Stop and Reverse (PSAR) indicator which shows this recent power move up, busting the dots to the upside and putting this indicator back in a bullish position.
The Stochastic indicator shows a recent bullish crossover, while the Moving Average Convergence Divergence (MACD) indicator looks to be threatening one.
Last week showed a positive candle after being in negative territory in the first half of the week. A nice little bullish reversal.
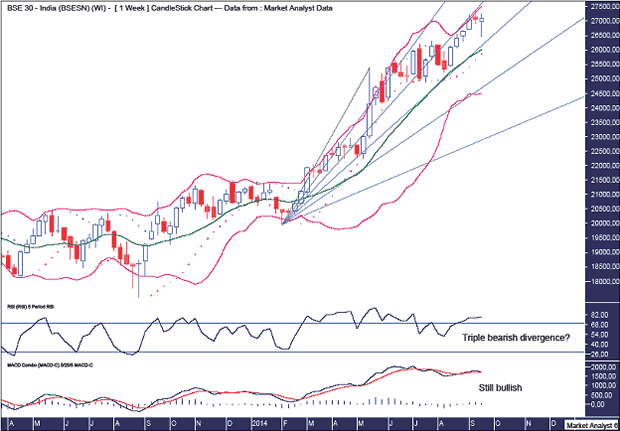
Price has moved away from the upper Bollinger Band, but it looks like it wants to have another crack at getting back up to it. One last hurrah, perhaps.
The PSAR indicator is still in a bullish position, so bias has to be given to more upside.
I have drawn a Fibonacci Fan which shows the move higher from the August lows has been nudging against the 38.2% angle. It may now struggle to get back above there. That would likely lead to a move back to the 50% angle and eventually lower. Breaking each angle indicates more weakness emerging.
The Relative Strength Indicator (RSI) looks to set up a triple bearish divergence on this next high. That should lead to a significant decline. That is still to be confirmed, obviously. Let’s wait and see.
The MACD indicator is still bullish, with the blue line above the red line. This coming top looks as if it could well form a bearish divergence here as well.
The RSI and MACD indicator continue to show the extremes at which this market is trading. A significant decline seems inevitable. The question is how much higher can price rise before that happens?
The PSAR indicator shows the dots still to the downside, but getting steeper. Just a matter of time before the dots catch price.
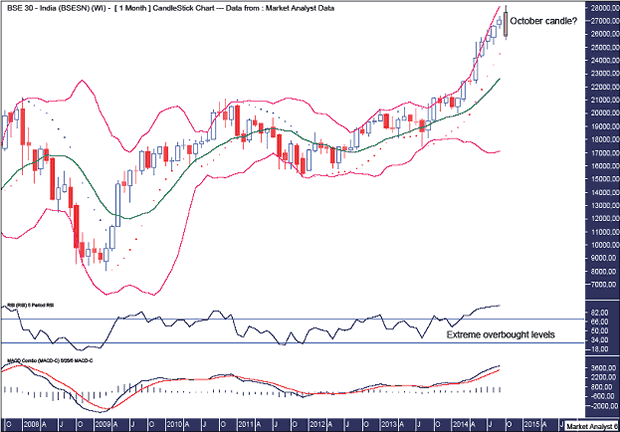
Even though price has moved higher this month, we can see there has been some movement away from the upper Bollinger Band. This looks ominous. Perhaps price has a crack at attaining the upper band once again at the beginning of October.
With just over a week left in this month of September and considering the daily and weekly analysis already undertaken, I feel the month will end in positive territory. However, things really are stretched. It’s becoming ridiculous, quite frankly. But the market often likes to push things to the extremes.
Given how stretched things appear, I feel the month of October will see this rubber band like market whip back. I have drawn what I think the October candle will look like. Now, this is clearly subjective on my behalf. It calls for a new high in October before a reversal back down. A negative outside reversal candle as the high is higher than the previous month while the low is lower, and it closes in negative territory.
We’ll just have to wait and see if things pan out like this. If it does, the next question will be is that the end of the bull market, or is it just a correction before another rally further down the track breaks to new highs? We can try to answer that question at a later stage if necessary.
To become a subscriber, subscribe to our free newsletter services. Our service is free for all.



 Unlock This Article