

COMEX Gold Spot Chart & Forecast
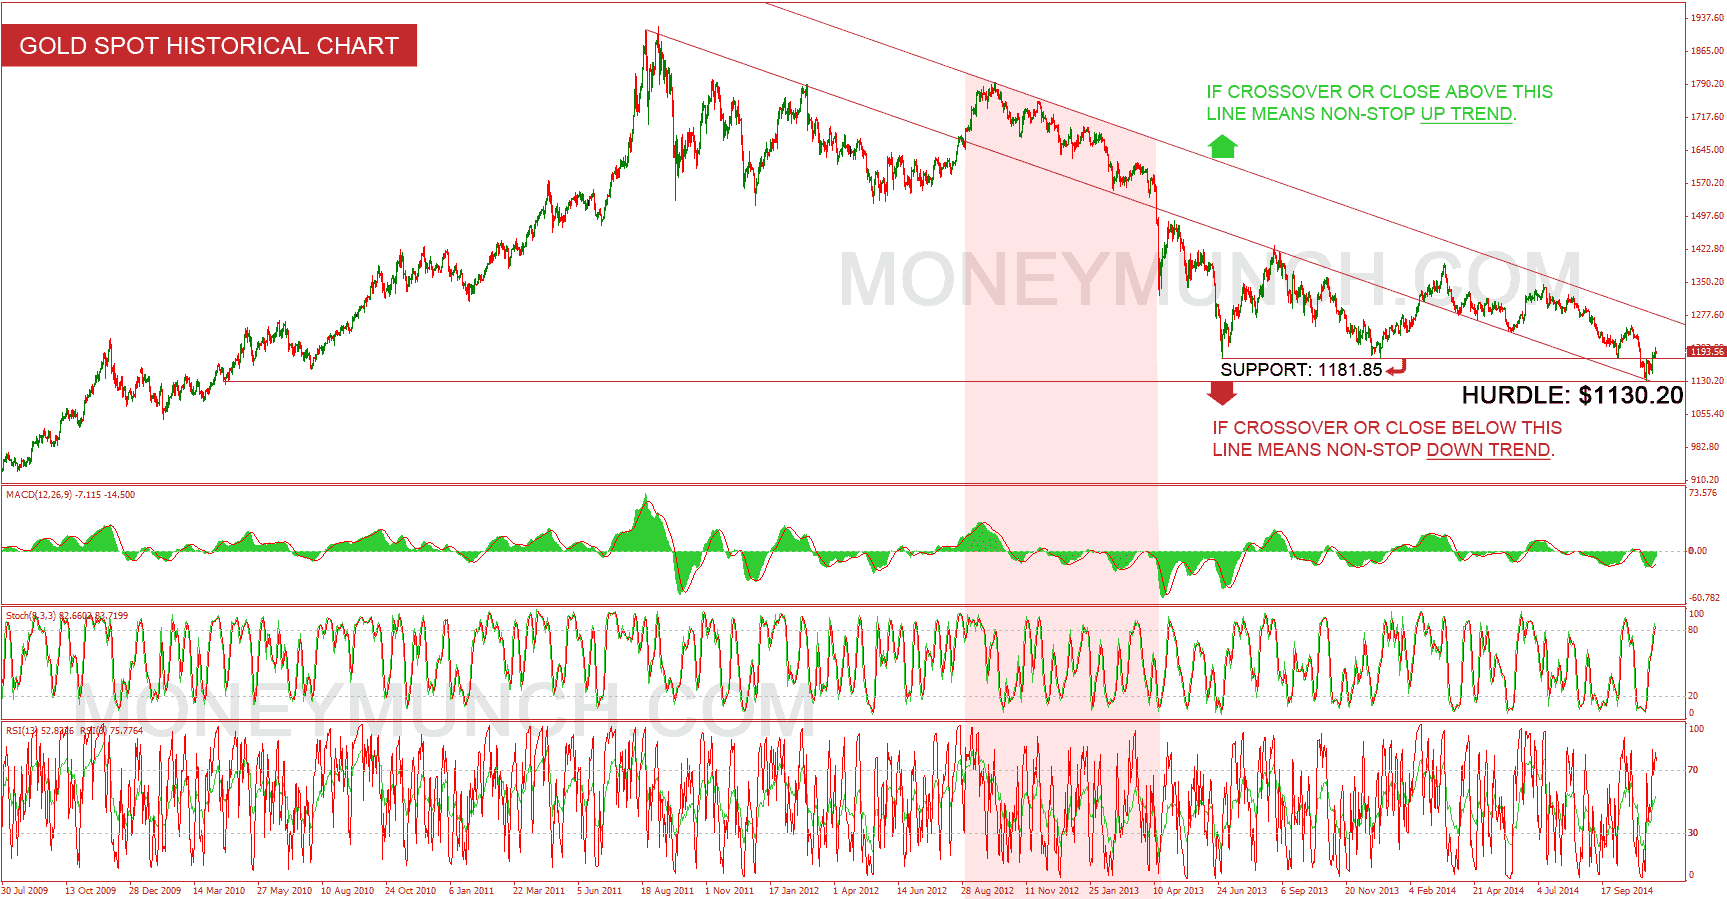
Look above COMEX Gold index chart, you can find reason easily why Indian gold is moving downwardly. I draw two important angle lines in chart to show you what happen if it crosses or close above / below the lines, and it’s just about future.
Very important thing, few weeks back gold spot was broken almost 1 year support $1181.85 and start running up, so we can expect we’ll see $1130.2 level again, but it happens if break again my support.
MCX Gold 4 year chart & tips
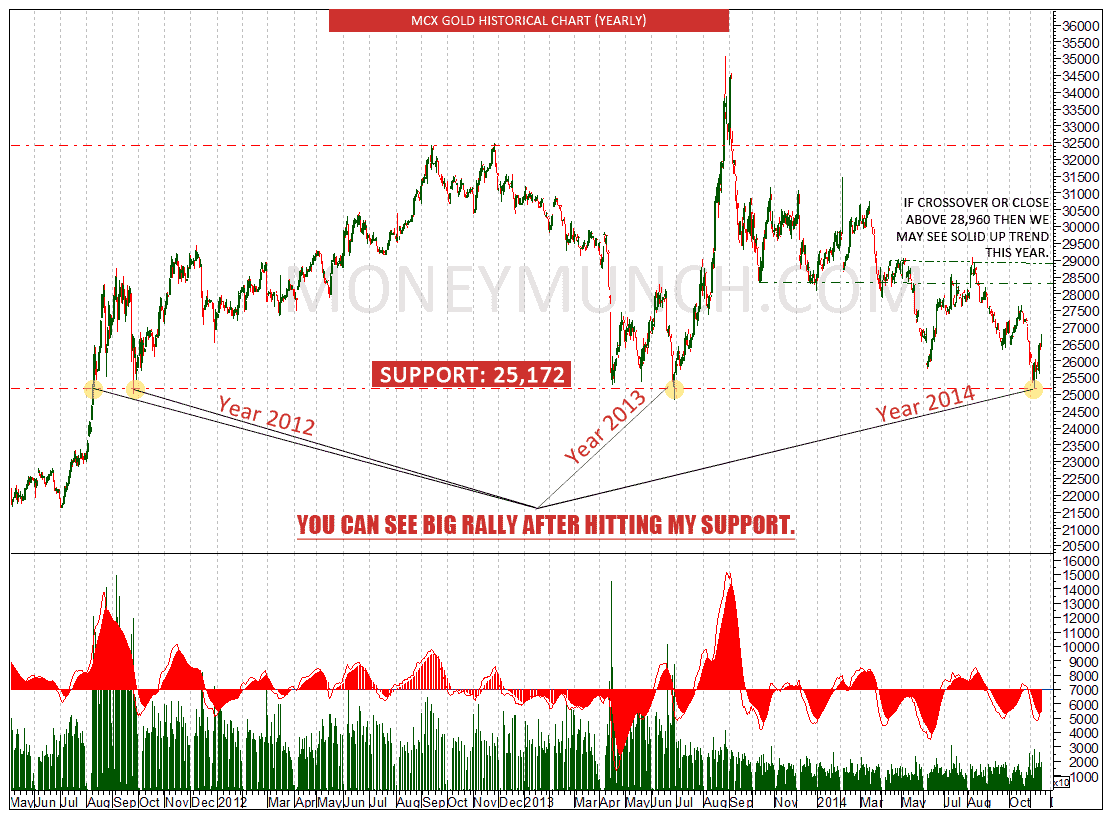
On above MCX Gold chart you can see 4 yellow circles and it’s highlighting what happen whenever gold touch support level 25,172. Now it’s clear gold will move up madly and touch 28000 – 29000 – 30000 bla bla bla but…but…but after some unbelievable down move. Wait and watch, it will show you 25500 – 26000 level soon!
MCX Silver 4 year chart & tips
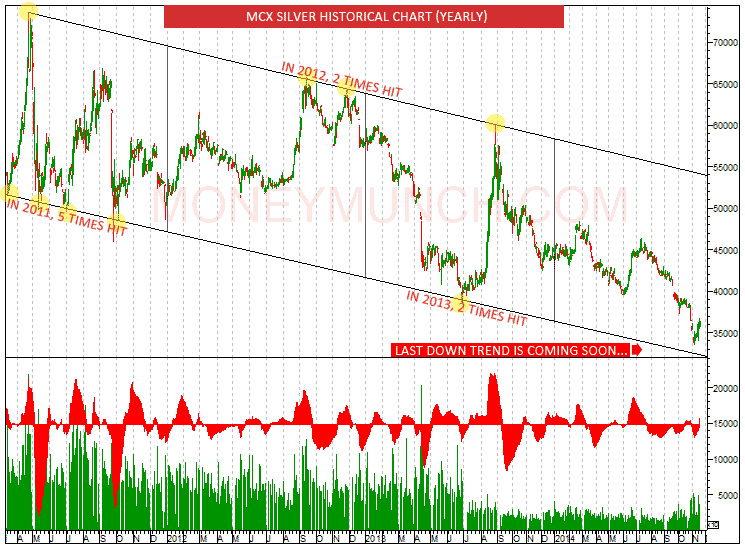
Look at above chart in yellow circles, from 2011 every year silver is hitting my two angle line minimum 2 times but in 2014 year silver playing between that lines so now you should have question when it will hit that lines? And when the last downtrend will come? Sorry but I will explain and say silver keys / secrets to subscriber and if you’re a subscriber then login to view full reports of silver.
To become a subscriber, subscribe to our free newsletter services. Our service is free for all.
 Unlock This Article
Get free forex & commodity ideas, chart setups, and analysis for the upcoming session:
Want to get premium trading alerts on XAUUSD, EURUSD, AUDUSD, GBPUSD, etc., and unlimited access to Moneymunch? Join today and start potentially multiplying your net worth: Premium Forex Signals
Premium features: daily updates, full access to the Moneymunch #1 Rank List, Research Reports, Premium screens, and much more. You΄ll quickly identify which commodities to buy, which to sell, and target today΄s hottest industries.
Have you any questions/feedback about this article? Please leave your queries in the comment box for answers.