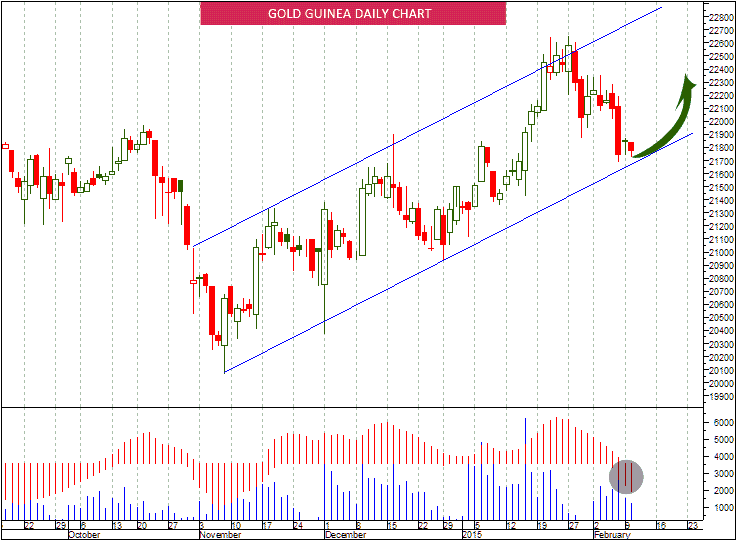
Gold is jumping like monkey but overall moving downside. Today we’ll see unpredictable up and down moves. Shortly downtrend will start so sellers should ready!
I will update gold predictable direction soon with chart. But look below Gold Guinea chart that will show you what will happen!
If breaks 21700 and close it below for 2 consecutive days then we will see big bloodbath. More information I will update soon for subscribers. To become a subscriber, subscribe to our free newsletter services. Our service is free for all.
For silver just remember closing below 37000 means 36108 – 35763 – 35246 – 34700. And if it not close below above level then we see 38000-39000-40000+ More information I will update soon…
Look above chart, Smart traders can understand what I am saying…
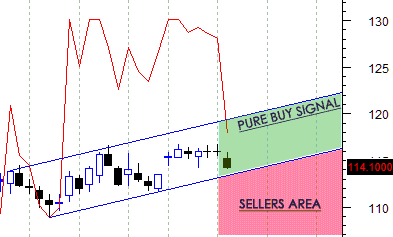
Buyers can purchase copper for few bucks, but sellers wait until it break $2.520 level. We’ll see at $2.460 – $2.420 soon.
 Updated for subscribers in locked only. To become a subscriber, subscribe to our free newsletter services. Our service is free for all.
 Unlock This Article