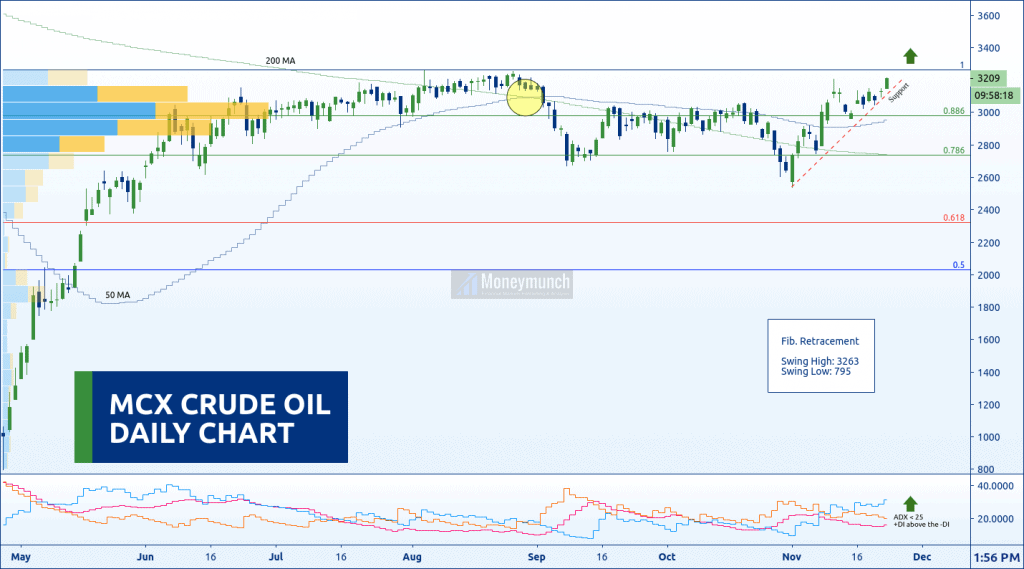
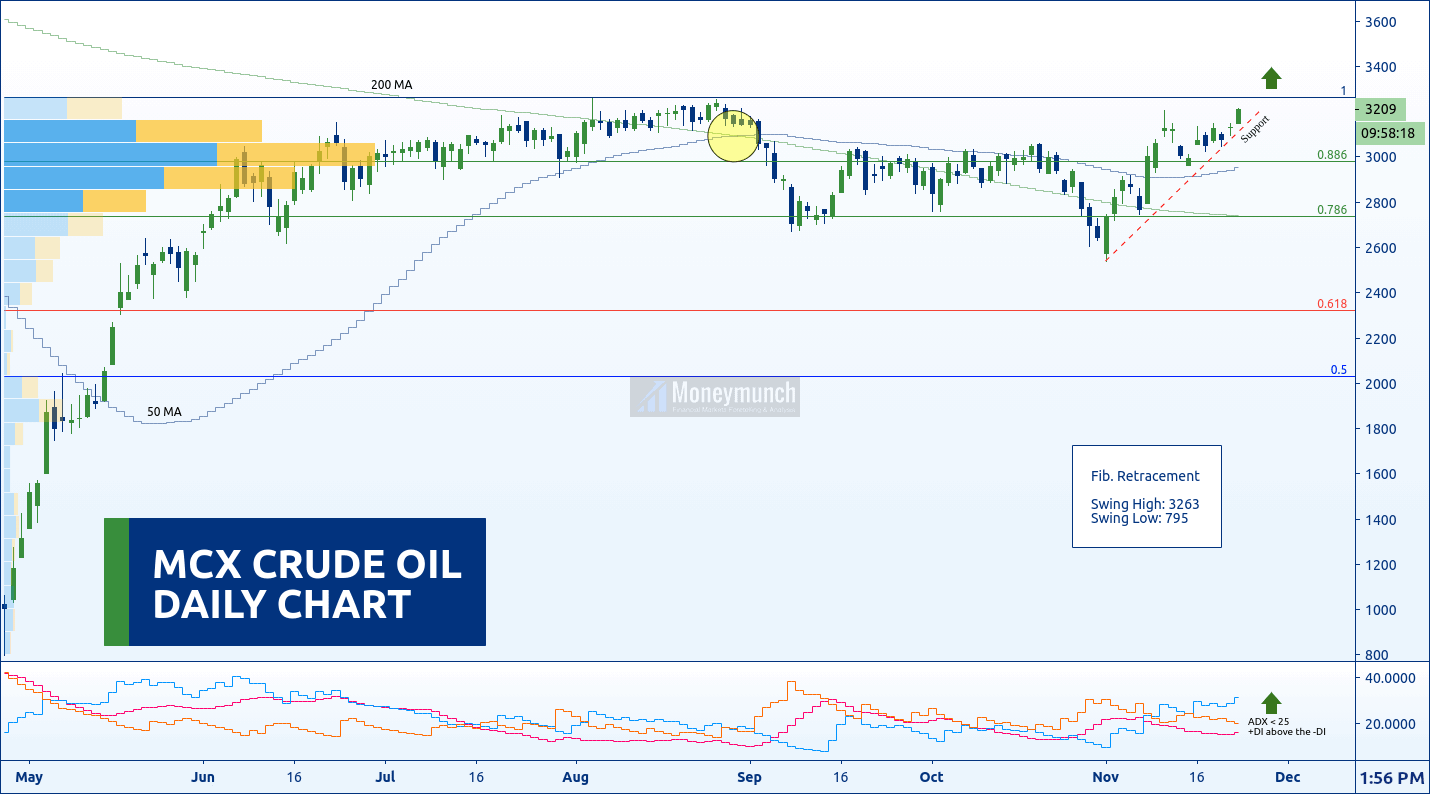
According to this chart, MCX crude oil is trying to climb upward. It has started upside rally from the beginning of May.
Here, I have applied Volume, DMI, MA, and Fib Retracement to identify the next move. Moving average of 50 & 200 is throwing direct up signals by crossover. And here, ADX is less than 25 but +DI above the -DI. Hence, we have chances to see slow movements.
Smart investors can buy for 3260 – 3300 – 3360 – 3400 levels.
In the previous trading session, it has created a Doji. It’s a direct sign of a reversal or trend continuation. But if it breaks the support line, the crude oil will fall to 88.6% (2982) – 78.6% (2735) of Fib retracement levels.
To become a subscriber, subscribe to our free newsletter services. Our service is free for all.
Get free MCX ideas, chart setups, and analysis for the upcoming session: Commodity Tips →
Have you any questions/feedback about this article? Please leave your queries in the comment box for answers.


Excellent Call Sir
MCX ka plan buy karne ke liye kya karna padega?
Sir, your analysis is extremely good, 3rd target reached great.
I took advantage of Blackfriday offer and purchased a plan and subscribed. 👍
Thank you so much for sharing your knowledge and experience. i booked full profit 3300
Thank you for the black Friday offer I missed the previous offer. I purchased a plan,subscribed and I regularly follow you.