Moneymunch.com

The Moneymunch editorial staff is a team of experienced financial writers and analysts with over a decade of experience in the financial markets. They have previously contributed to popular financial blogs and newspapers, and are passionate about providing accurate and up-to-date information to help both investors and traders make informed decisions. Trust the Moneymunch editorial staff to provide reliable and effective financial advice that can help you achieve your financial goals.

Moving Average Convergence/Divergence (MACD) Oscillator

This is the 21th Day course in a series of 60-Days called “Technical Analysis Training

You will get daily one series of this Training after 8 o’clock night (Dinner Finished)

Follow MoneyMunch.com Technical Analysis Directory and Learn Basic Education of Technical Analysis on the Indian Stock Market (NSE/BSE)

Technical-Analysis-Training

Moving Average Convergence/Divergence (MACD) Oscillator

Implication

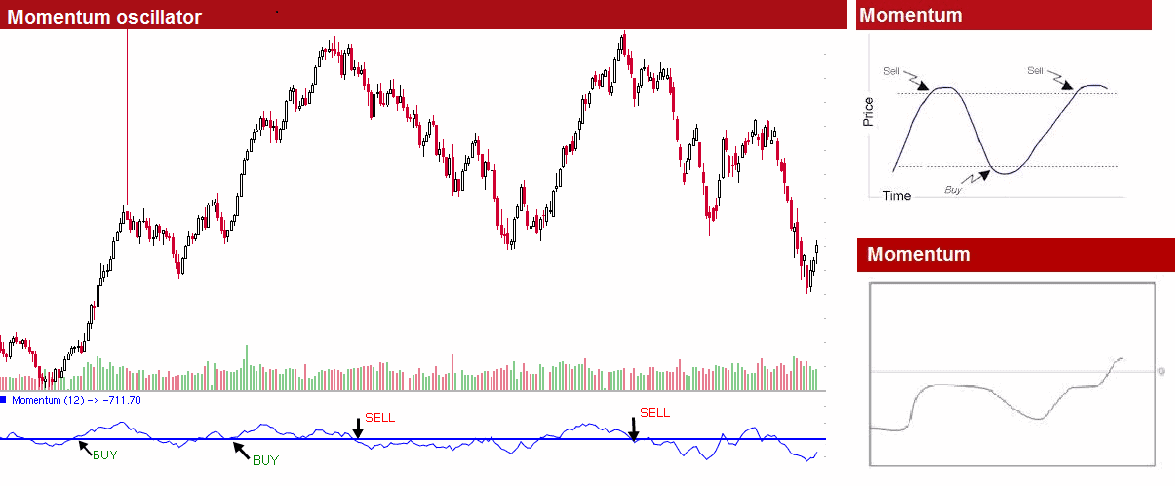
If the MACD crosses the signal line or the zero line (the event), a bullish or bearish signal is created based on the direction of the crossovers.

Description

The MACD, “Moving Average Convergence/Divergence”, tells the connection in between two moving averages of prices. The MACD is the difference between a 26-day and 12-day exponential moving average. A 9-day exponential moving average named the “signal line” is plotted on top of the MACD to give bullish and bearish signal tips. A bullish signal is created after the MACD rises above the signal line, or above zero. A bearish signal happens after the MACD comes below the signal line or below zero.

stochastic-oscillator.jpg

Trading Considerations

The MACD is most effective in powerfully  finding trend of markets.

The MACD suggests overbought and oversold situations. An overbought situation happens whenever prices have increased too far too fast and also are set for a downward correction. An oversold situation happens whenever prices have fallen too far too fast and are set for an upward correction. When the shorter moving average pulls away from the longer moving average (i.e., the MACD rises), it’s probably that the financial instrument’s price is too high and will soon get back to more realistic levels.

An indication that an end to the current trend may be near happens whenever MACD diverges through the financial instrument’s price. A bearish divergence happens whenever MACD is making new lows while prices fail to reach new lows. A bullish divergence occurs whenever the MACD is making new highs while prices are unsuccessful to reach new highs. These two divergences are most significant when they happen at comparatively overbought/oversold levels.

Message for you(Trader/Investor): Google has the answers to most all of your questions, after exploring Google if you still have thoughts or questions my Email is open 24/7. Each week you will receive your Course Materials. You can print it and highlight for your Technical Analysis Training.

Wishing you a wonderful learning experience and the continued desire to grow your knowledge. Education is an essential part of living wisely and the Experiences of life, I hope you make it fun.

Learning how to profit in the Stock Market requires time and unfortunately mistakes which are called losses. Why not be profitable while you are learning?

Continue reading

Momentum Oscillator: Technical Analysis Training

This is the 22th Day course in a series of 60-Days called “Technical Analysis Training

You will get daily one series of this Training after 8 o’clock night (Dinner Finished)

Follow MoneyMunch.com Technical Analysis Directory and Learn Basic Education of Technical Analysis on the Indian Stock Market (NSE/BSE)

Technical-Analysis-Training

Momentum Oscillator

Effect of Momentum Oscillator

Momentum measures the amount that a financial instrument’s price has changed over a given timeframe. Momentum is significant because it signals the strength of price trends.The Momentum rises above 0 , a bullish noticeable  is cause. When the Momentum falls below 0, the Technical Analysis is a bearish signal.

Narration

Momentum measures the amount that a financial equipment price has changed over a given time frame  Momentum is important because it indicate the strength of price trends. A healthy price trend tends to show strong momentum, while decline trends generally have decreasing momentum indicating a trend reversal or correction. Momentum can also indicate short-term market excess referred to as overbought and oversold levels. A bullish signal is generated when the Momentum rises above 0 and a bearish signal is generated when the Momentum falls below 0.


Momentum is calculated as a ratio of today’s price compared to the price n periods ago. The formula is [Close/(Close n time-periods ago) times 100].

momentum

Trading Factor:

Momentum can be used as a trend-following oscillator similar to the MACD. A bullish indicate is achieved when the indicator bottoms and turns up.
A bearish signal is achieved when the indicator peaks and turns down.

If the Momentum indicator influence extremely higher low values (relative to its historical values),

a continuity of the current trend may be called for. For example, if the Momentum indicator reaches extremely high values and then turns down, one could predict prices will probably go still higher.In either case, only trade after prices confirm the signal generated by the indicator (e.g., if prices peak and turn down, wait for prices to begin to fall before selling).

The Momentum indicator can also be used as a leading indicator.This method assumes that market tops are typically identified by a rapid price increase (when everyone expects prices to go higher)and that market bottoms typically end with rapid price declines (when everyone wants to get out). As a market peaks, the Momentum indicator will climb sharply and then fall off–diverging from the continued upward or sideways movement of the price.

Similarly, at a market bottom, the Momentum indicator will drop sharply and then begin to climb well ahead of prices.Both of these situations result in divergences between the indicator and prices.

Message for you(Trader/Investor): Google has the answers to most all of your questions, after exploring Google if you still have thoughts or questions my Email is open 24/7. Each week you will receive your Course Materials. You can print it and highlight for your Technical Analysis Training.

Wishing you a wonderful learning experience and the continued desire to grow your knowledge. Education is an essential part of living wisely and the Experiences of life, I hope you make it fun.

Learning how to profit in the Stock Market requires time and unfortunately mistakes which are called losses. Why not be profitable while you are learning?

Continue reading

Corrective Wave: Technical Analysis Training

This is the 22th Day course in a series of 60-Days called “Technical Analysis Training

You will get daily one series of this Training after 8 o’clock night (Dinner Finished)

Follow MoneyMunch.com Technical Analysis Directory and Learn Basic Education of Technical Analysis on the Indian Stock Market (NSE/BSE)

Technical-Analysis-Training

Corrective Waves 

Effect of Corrective Waves 

Markets move against the trend of one greater amount only with a seeming conflict. Resistance from the greater trend appears to forbid a correction from establish a full impulsive format. The struggle between the two oppositely trending amount generally makes corrective waves less clearly identifiable than impulsive waves, which always flow with comparative ease in the direction of the one greater trend. As another result of the conflict between trends, corrective waves are quite a bit more varied than impulsive waves.

Corrective patterns fall into four main categories:

Zigzags (5-3-5; includes three variations: single, double, triple);
Flats (3-3-5; includes three variations: regular, expanded, running);
Triangles (3-3-3-3-3; four types: ascending, descending, contracting, expanding);
Double threes and triple threes (combined structures).

ZIGZAGS (5-3-5)

A single zigzag in a bull market is a simple three-wave declining pattern labeled A-B-C and subdividing 5-3-5. The top of wave B is noticeably lower than the start of wave A, as illustrated in Figures 1 and 2.

hardly zigzags will occur twice, or at most, three times in series, especially when the first zigzag falls short of a normal target. In these cases, each zigzag is separated by an intervening “three” (labeled Q), producing what is called a double zigzag (see Figure 3) or triple zigzag. The zigzags are labeled P and R (and S, if a triple)

Untitled

zigzag3 copy copy

FLATS (3-3-5)

A flat correction vary from a zigzag in that the subwave progression is 3-3-5, as shown in Figures 4 and 5. Since the first actionary wave, wave A, lacks sufficient downward force to unfold into a full five waves as it does in a zigzag, the B wave reaction seems to innerit this lack of countertrend burden and, not surprisingly, abolish near the start of wave A. Wave C, in turn, generally terminates just slightly beyond the end of wave A rather than somewhat beyond as in zigzags.

Flat corrections usually retrace less of preceding impulse waves than do zigzags. They participate in periods involving a strong greater trend and thus essentially always precede or follow extensions. The more strom the underlying trend, the briefer the flat tends to be. Within impulses, fourth waves frequently sport flats, while second waves barely do.

Three types of 3-3-5 corrections have been analyze by variation in their overall shape. In a regular flat correction, wave B terminates about at the level of the beginning of wave A, and wave C terminates a slight bit past the end of wave A, as we have shown in Figures 4 and 5. Far more common, however, is the variety called an expanded flat, which contains a price extreme beyond that of the preceding impulse wave. In expanded flats, wave B of the 3-3-5 pattern terminates beyond the starting level of wave A, and wave C ends more extensively beyond the ending level of wave A, as shown in Figures 6 and 7. In a rare variation on the 3-3-5 pattern, which we call a running flat, wave B terminates well beyond the beginning of wave A as in an expanded flat, but wave C fails to travel its full distance, falling short of the level at which wave A ended. There are hardly any examples of this type of correction in the record.

Untitled 1

Untitled 2

Message for you(Trader/Investor): Google has the answers to most all of your questions, after exploring Google if you still have thoughts or questions my Email is open 24/7. Each week you will receive your Course Materials. You can print it and highlight for your Technical Analysis Training.

Wishing you a wonderful learning experience and the continued desire to grow your knowledge. Education is an essential part of living wisely and the Experiences of life, I hope you make it fun.

Learning how to profit in the Stock Market requires time and unfortunately mistakes which are called losses. Why not be profitable while you are learning?

Continue reading

Motive (Impulse) Waves: Technical Analysis Training

This is the 22th Day course in a series of 60-Days called “Technical Analysis Training

You will get daily one series of this Training after 8 o’clock night (Dinner Finished)

Follow MoneyMunch.com Technical Analysis Directory and Learn Basic Education of Technical Analysis on the Indian Stock Market (NSE/BSE)

Technical-Analysis-Training

Motive (Impulse) Waves 

Effect of Motive Waves 

The most common motive wave is an impulse. Motive waves separated into five waves with certain peculiar and always move in the same direction as the trend of one larger degree. They are straightforward and comparably easy to recognize and clarify.

Within motive waves, wave 2 never retraces more than 100% of wave 1, and wave 4 never retraces more than 100% of wave 3. Wave 3, moreover, always travels beyond the end of wave 1. The goal of an impulse is to make progress, and these rules of formation assure that it will.

Elliott further discovered that in price terms, wave 3 is repeatedly the longest and never the shortest among waves 1, 3 and
5. As long as wave 3 endure a greater percentage movement than either wave 1 or 5, this rule is satisfied. It almost always holds on an arithmetic basis as well. There are two types of motive waves: impulses and diagonal triangles

 motive-wave

The most common motive wave is an impulse. In this, wave 4 does not enter the territory of “overlap” wave 1. This rule holds for all non-leveraged cash basis markets. Futures markets, with their extreme leverage, can induce short term price extremes that would not occur in cash markets. Even so, overlapping is frequently confined to daily and intraday price variation and even then is extremely rare. In addition, the actionary subwaves (1, 3 and 5) of an impulse are themselves motive, and subwave 3 is specifically an impulse. Figures 2, 3 and 4 all depict impulses in the 1, 3, 5, A and C wave positions.

It the above four pessage, there are only a few simple guidelines for depict impulses identically. A guideline is so called because it governs all waves to which it applies. Typical, yet not inevitable, peculiarity of waves are called guidelines, which are discussed in an upcoming section. A rule should never be disregarded. In many years of practice with countless patterns, the authors have found but one instance above Subminuette degree when all other rules and guidelines combined to suggest that a rule was broken. Analysts who routinely break any of the rules detailed in this section are practicing some form of analysis other than that guided by the Wave Principle. These rules have great practical utility in correct counting, which we will explore further in discussing extensions.

concentration

A truncated fifth wave does not move beyond the end of the third. It can frequently be verified by noting that the presumed fifth wave contains the necessary five subwaves, as illustrated in Figures3. Truncation gives warning of underlying weakness or strength in the market. In application, a truncated fifth wave will often cut short an expected target. This annoyance is counterbalanced by its clear implications for persistence in the new direction of  trend.

 final1

Message for you(Trader/Investor): Google has the answers to most all of your questions, after exploring Google if you still have thoughts or questions my Email is open 24/7. Each week you will receive your Course Materials. You can print it and highlight for your Technical Analysis Training.

Wishing you a wonderful learning experience and the continued desire to grow your knowledge. Education is an essential part of living wisely and the Experiences of life, I hope you make it fun.

Learning how to profit in the Stock Market requires time and unfortunately mistakes which are called losses. Why not be profitable while you are learning?

Continue reading