

Timeframe: Weekly
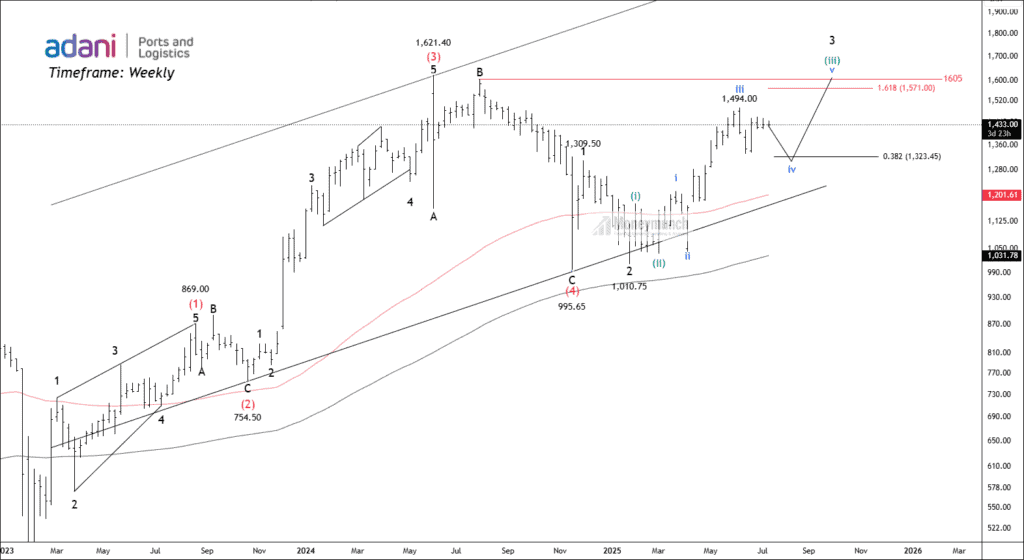
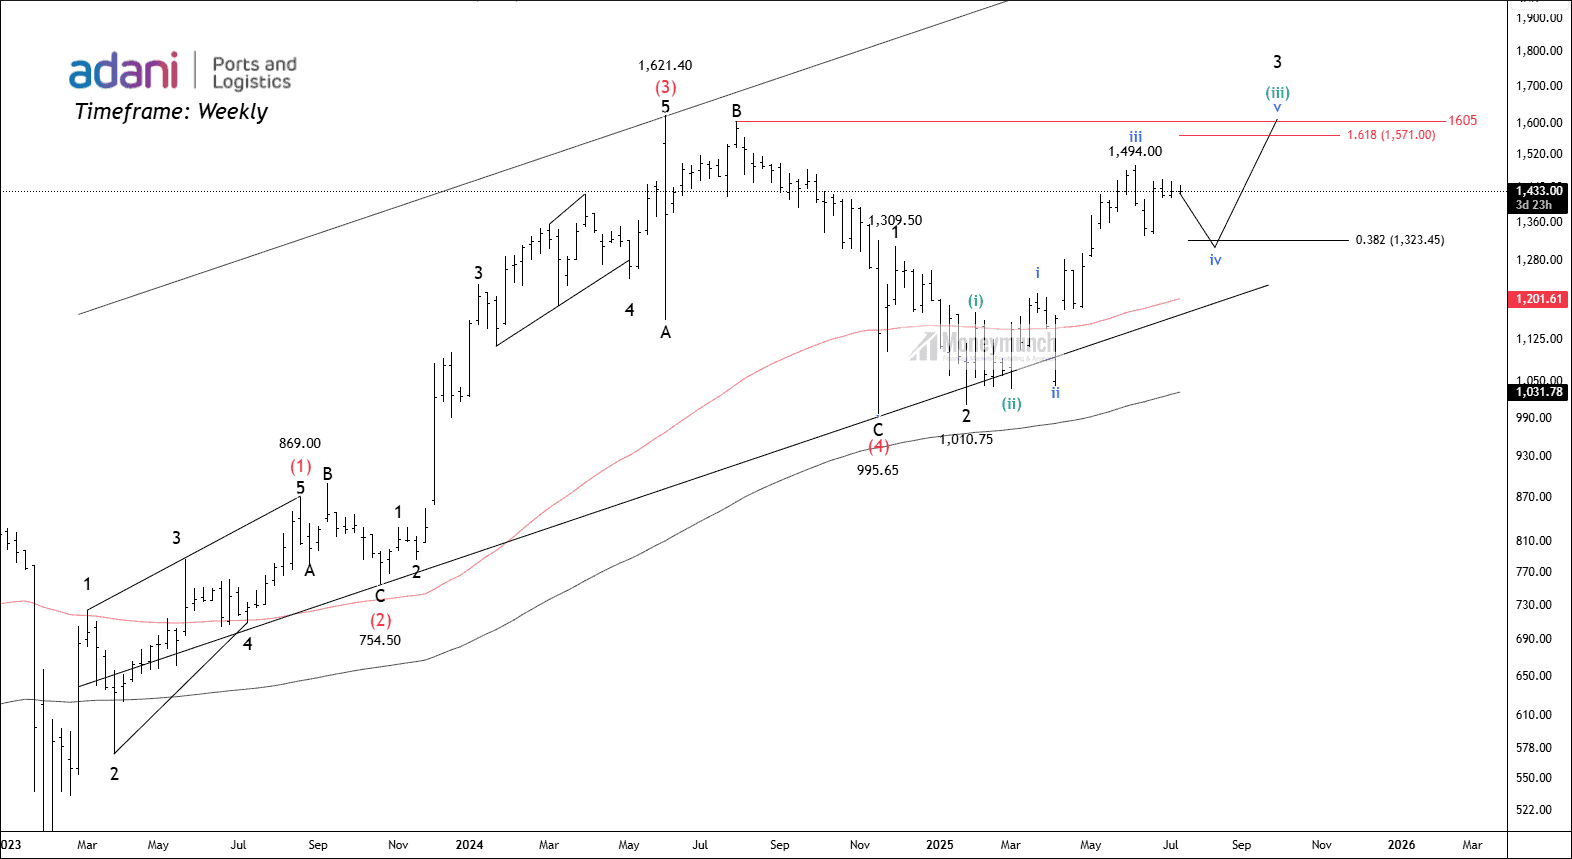
The weekly chart of Adani Ports and Logistics shows a strong uptrend supported by Elliott Wave analysis. After completing Wave (1) near 869 and a corrective Wave (2) down to 754.50, the stock moved sharply higher to 1,621.40, which marked the top of Wave (3). This was followed by a complex correction (A-B-C), bottoming around 995.65 as Wave (4). From that point, the stock has resumed its upward trend, forming smaller waves within a larger Wave 3. Currently, it looks like wave (iii) is forming, and a short correction (wave iv) might take the price down to around 1,323 before moving higher again, with the next major target near 1,524- 1,600 – 1675+.
Looking at the moving averages, the 100 EMA (red) is around 1,201, and the 200 EMA (black) is near 1,031. Since the price is trading well above both, it indicates strong bullish momentum. These levels are likely to act as support if the price pulls back. As long as the stock stays above the 100 and 200 EMAs and follows the current wave structure, the overall trend remains positive, with a good possibility of reaching higher targets in the coming weeks.
Only premium members will have access to further information.
Get free important share market ideas on stocks & nifty tips chart setups, analysis for the upcoming session, and more by joining the below link: Stock Tips
Have you any questions/feedback about this article? Please leave your queries in the comment box for answers.

Brilliant wave count! The alignment with Fibonacci targets and EMA support levels
Love how clean and logical the wave structure is. Textbook Elliott Wave formation.
Beautiful chart!