

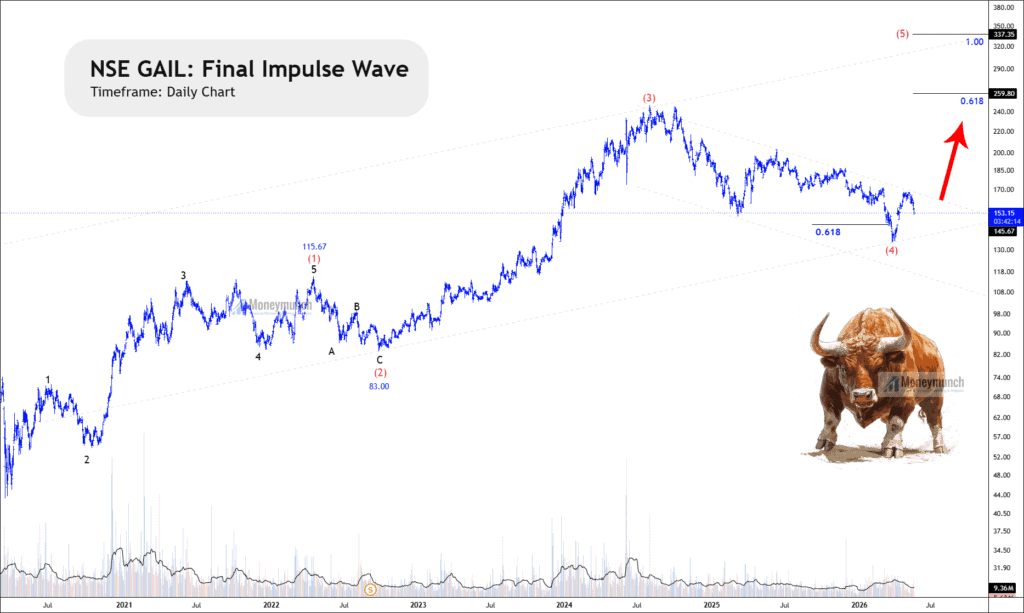
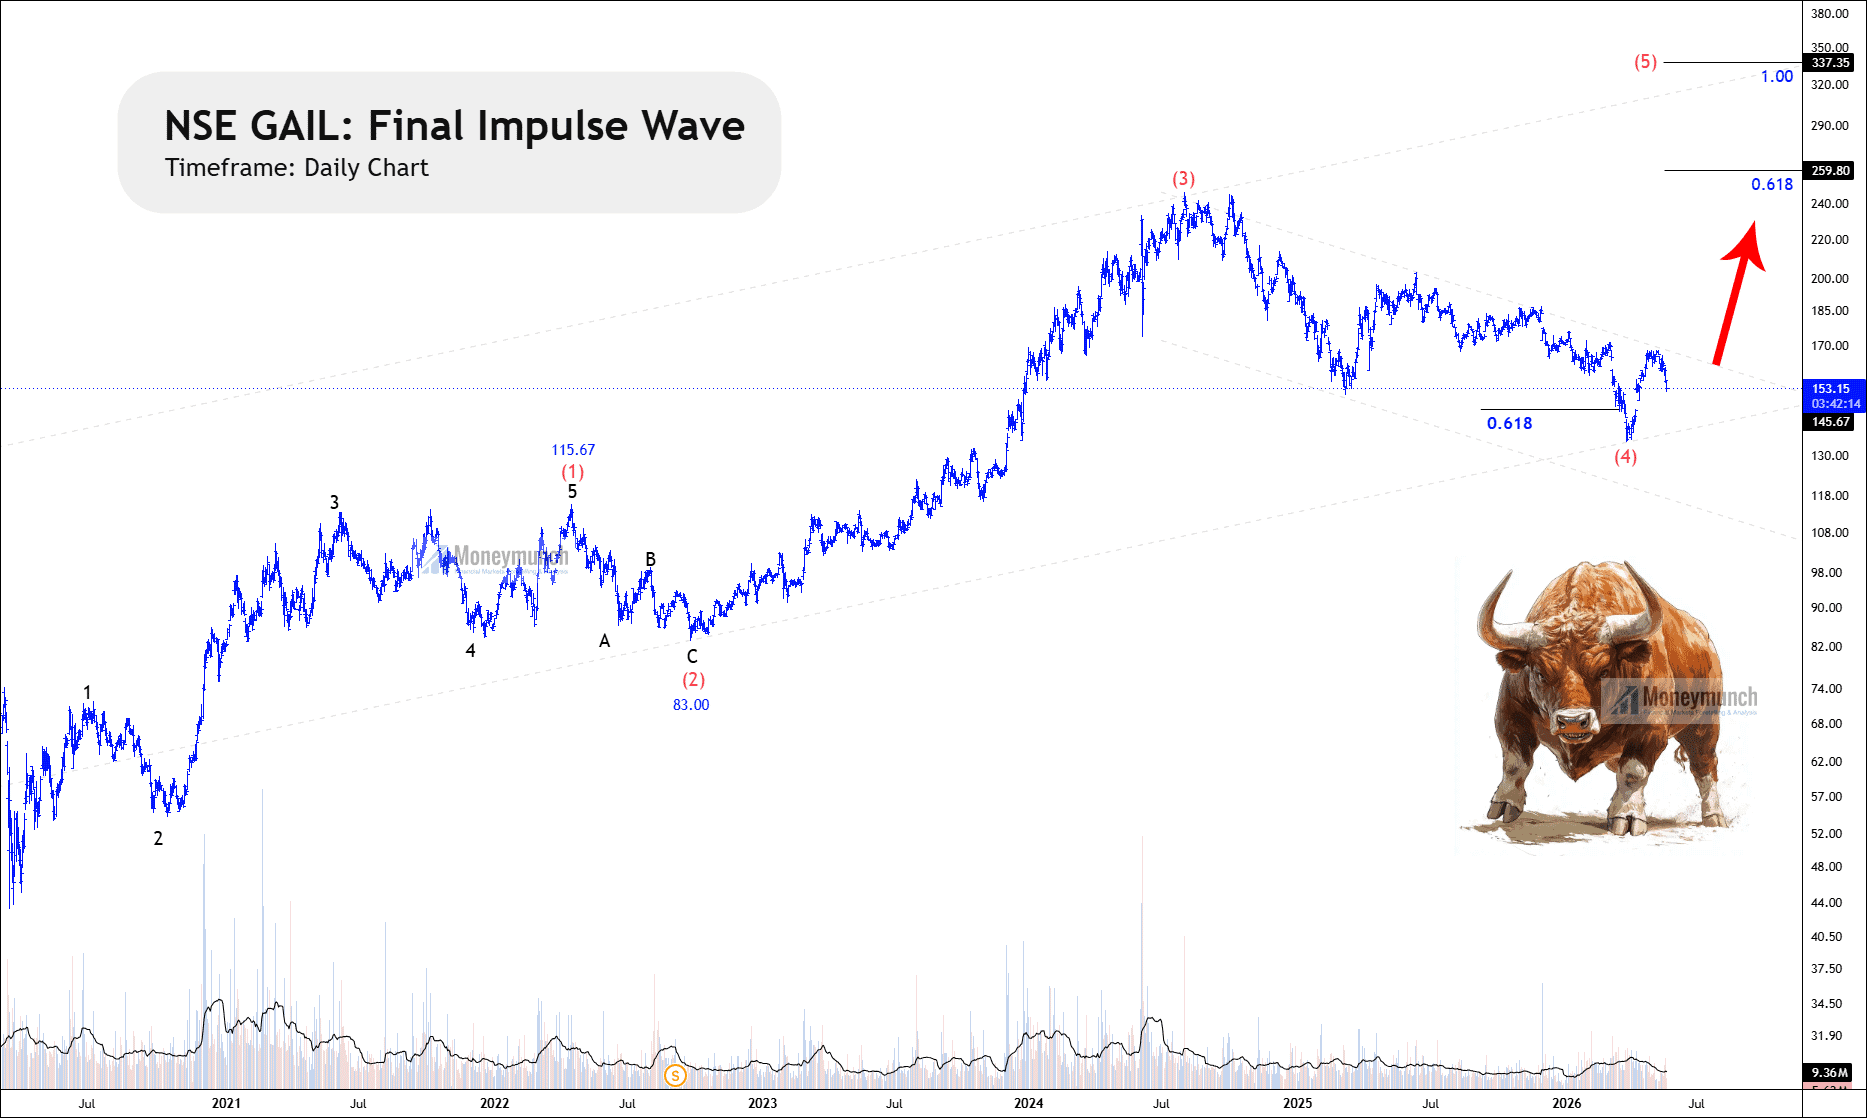
Gail (India) Limited: Daily Timeframe Analysis with Wave (5) Projection Zones
NSE GAIL is currently showing a long-term bullish Elliott Wave structure on the daily chart. The stock appears to have completed a major corrective Wave (4) after a strong impulsive Wave (3) rally. The reaction from 0.618 region strengthens the possibility that Wave (4) may already be complete.
Targets: 259 – 293 – 337
Failure to hold above the recent Wave (4) region could delay or weaken the bullish Wave (5) scenario.
Get free important share market ideas on stocks & nifty tips chart setups, analysis for the upcoming session, and more by joining the below link: Stock Tips
Have you any questions/feedback about this article? Please leave your queries in the comment box for answers.
Disclaimer: The information provided on this website, including but not limited to stock, commodity, and forex trading tips, technical analysis, and research reports, is solely for educational and informational purposes. It should not be considered as financial advice or a recommendation to engage in any trading activity. Trading in stocks, commodities, and forex involves substantial risks, and you should carefully consider your financial situation and consult with a professional advisor before making any trading decisions. Moneymunch.com and its authors do not guarantee the accuracy, completeness, or reliability of the information provided, and shall not be held responsible for any losses or damages incurred as a result of using or relying on such information. Trading in the financial markets is subject to market risks, and past performance is not indicative of future results. By accessing and using this website, you acknowledge and agree to the terms of this disclaimer.

One of the best setups I’ve seen
Chart se market nahi chalta.
thanks for free tips
The reason behind planning to buy your premium service is here. Your hard work without any fees. See you soon Guruji
How to join a paid service?
Pricing Plans: https://moneymunch.com/our-service/
gail ka rate 160 hai