

Why Fibonacci Tools Are Better Than Traditional Technical Analysis Tools
Many people still believe that buying stocks of old and strong companies and holding them for years is the best way to make money. They think long-term investing is always better than disciplined short-term trading.
But investors should understand one important thing: during a financial crisis or recession, even good companies can fall sharply. When large investment funds face heavy withdrawals, they are forced to sell shares to return money to investors. At that time, they may sell shares of both weak and strong companies.
I have studied and cleared exams such as Research Analyst, Technical Analysis, Wealth Management, Derivatives, and also studied Series 65. In most technical analysis courses, people often say, “Trend is your friend.”
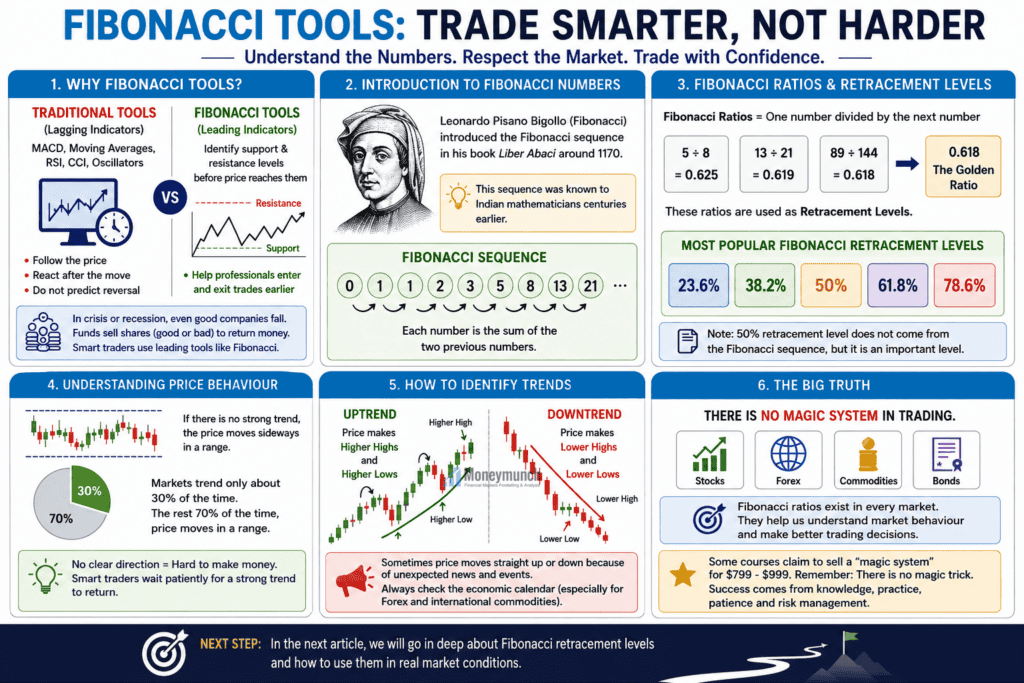
They teach indicators such as MACD, Moving Averages, RSI, CCI, and many other oscillators. These are called lagging indicators. A lagging indicator follows price movement after it has already started. It reacts to the trend instead of predicting a reversal.
But have you heard about leading indicators?
There are many leading indicators, but today we will discuss one of the best tools: Fibonacci tools.
Fibonacci tools can help traders identify support and resistance levels before the price reaches them. Professional traders often use leading indicators because they want to enter and exit trades early.
Introduction to Fibonacci Numbers
Leonardo Pisano Bigollo, born around 1170 in Italy and better known as Leonardo Fibonacci, introduced the Fibonacci sequence to the Western world through his book Liber Abaci. Interestingly, Indian mathematicians already knew about this sequence centuries earlier.
The Fibonacci sequence starts like this:
- 0
- 1
- 0 + 1 = 1
- 1 + 1 = 2
- 1 + 2 = 3
- 2 + 3 = 5
- 3 + 5 = 8
- 5 + 8 = 13
- …and so on.
Each number is created by adding the previous two numbers together.
Fibonacci Ratios and Retracement Levels
Fibonacci ratios are created by dividing one Fibonacci number by the next number in the sequence.
Examples:
- 5 ÷ 8 = 0.625
- 13 ÷ 21 = 0.619
- 89 ÷ 144 = 0.618
The value 0.618 is known as the Golden Ratio. We will understand this concept in detail with examples in upcoming educational articles.
These ratios are also used as retracement levels in trading.
The most popular Fibonacci retracement levels are:
- 23.6%
- 38.2%
- 50%
- 61.8%
- 78.6%
Note: The 50% retracement level does not come directly from the Fibonacci sequence, but traders still consider it an important level.
Understanding Price Behaviour
Before learning Fibonacci tools deeply, we first need to understand how price behaves in the market.
What Happens When There Is No Trend?
If there is no strong trend, the market usually moves sideways in a range.
Statistics suggest that markets trend only about 30% of the time. The rest of the time, prices move sideways.
During sideways markets, there is no clear direction. It becomes difficult to make profitable trades. Smart traders often wait patiently for a strong trend to return before entering the market.
How to Identify an Uptrend and a Downtrend
Uptrend
An uptrend happens when the price creates:
- Higher highs
- Higher lows
Downtrend
A downtrend happens when the price creates:
- Lower highs
- Lower lows
Sometimes you may see prices moving straight up or straight down very quickly. This usually happens because of unexpected news or major events.
If you trade Forex or international commodities, always pay attention to the economic calendar.
Why I Am Writing This Article
Some courses claim to teach a “magic trading system” based on Fibonacci tools. Many of these courses cost between $799 and $999.
But remember this clearly:
There is no magic system in trading.
No indicator or strategy can guarantee profits every time.
Whether you trade stocks, Forex, commodities, or bonds, you will find Fibonacci ratios used everywhere because they help traders understand market behaviour better.
What’s Next?
In the next article, we will study Fibonacci retracement levels in greater detail and learn how traders use them in real market conditions.
Get free forex & commodity ideas, chart setups, and analysis for the upcoming session:
Want to get premium trading alerts on XAUUSD, EURUSD, AUDUSD, GBPUSD, etc., and unlimited access to Moneymunch? Join today and start potentially multiplying your net worth: Premium Forex Signals
Premium features: daily updates, full access to the Moneymunch #1 Rank List, Research Reports, Premium screens, and much more. You΄ll quickly identify which commodities to buy, which to sell, and target today΄s hottest industries.
Have you any questions/feedback about this article? Please leave your queries in the comment box for answers.

Thanks for the detailed explanation on the Fibonacci sequence calculation. Mostly I were confused here.
It’s beginner friendly. Thanku