
Timeframe: 1h
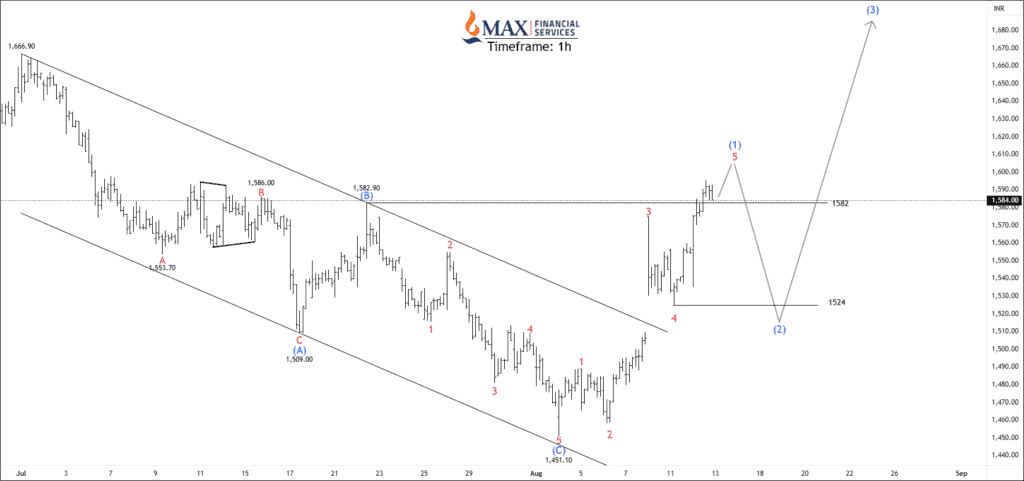
We can see a completed ABC correction pattern, where Wave (A) ended near 1,509 and Wave (C) finished at 1,451.10. After this, the price broke out of its downward trend and moved into a clear five-wave upward move, shown in red and marked as Wave (1) in blue. This upward rally reached just below 1,600, showing strong buying momentum before starting a pullback. The price is trading above the 50-, 100-, and 200-day EMAs.
The ATR is at 36.30, showing that volatility has been relatively high in recent sessions. The ADX reads 22.14, which means there’s a trend in place, but it’s still not fully strong or mature. Right now, the price seems to be heading into wave 5 of wave (1). Once that completes, we could see a wave (2) correction, likely pulling back toward the 1524 area, which lines up with the wave 4 zone of wave (1). Traders can trade for the following targets: 1582 – 1645 – 1700+.
Get free important share market ideas on stocks & nifty tips chart setups, analysis for the upcoming session, and more by joining the below link: Stock Tips
Have you any questions/feedback about this article? Please leave your queries in the comment box for answers.
Agree with the bullish view. Thanks for sharing.
Noted your levels for tomorrow’s trade.
I love these kinds of chart analysis.