
Timeframe: Daily
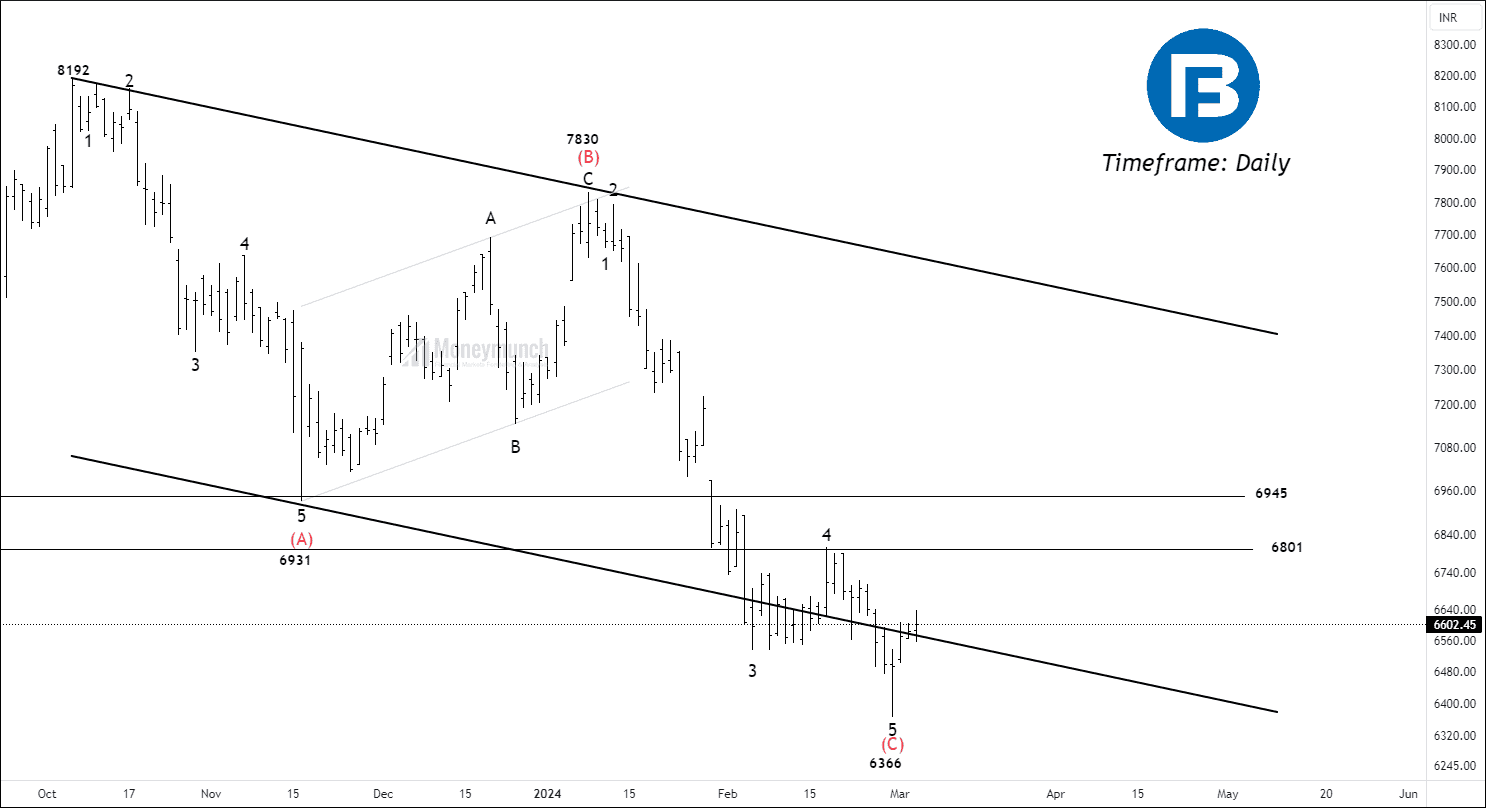
Following its peak at 8192, NSE BAJAJ Finserv has developed a correction structure. The average directional movement indicator has surged to 36.05, indicating significant directional movement during this correction phase. Presently, the prices are trading below the 10/35/50 simple moving averages (SMA), further confirming the bearish sentiment. This suggests that the downtrend may persist in the near term.
According to wave principle, the price has accomplished wave (B), and wave (C) has taken place. Wave (C) extended 1.618% of wave (A). sub-waves of waves are visible. If the price breaks out wave 4 of wave (4) at 6801 and sustains above it, traders can ride the unfolding impulsive wave with the following targets: 6945 – 7143 – 7357+.
We will update further information soon.
NSE INFY – Bearish Setup
On the daily timeframe chart, NSE INFY is displaying a bearish trend. The ADX indicator for the price has recently risen to 15.59, indicating increasing bearish momentum. Moreover, the price has breached the 10/35 simple moving average (SMA) and is currently holding below the 50 SMA.
A significant support zone at 1647 has been broken, with the price closing below it. Sustained trading below 1647 could indicate further downside potential. Traders may consider the following targets: 1635 – 1622 – 1605.
For free subscribers, it’s advisable to use the previous day’s low as an invalidation level. This means if the price rises above the previous day’s low, the bearish setup may be invalidated, and traders should reassess their positions accordingly.
 Unlock This Article
Get free important share market ideas on stocks & nifty tips chart setups, analysis for the upcoming session, and more by joining the below link: Stock Tips
Have you any questions/feedback about this article? Please leave your queries in the comment box for answers.
Very good 👍
Awesome work!!!
Any new update on commodity?