Nifty Update: The Case Of Initiative And Response Between Bulls & Bears

I had updated an hourly chart of Nifty the day before yesterday. Click the below link to open it.

Nifty Today: The Case Of Initiative And Response Between Bulls & Bears

free nse nifty hourly chart tips

BEFORE

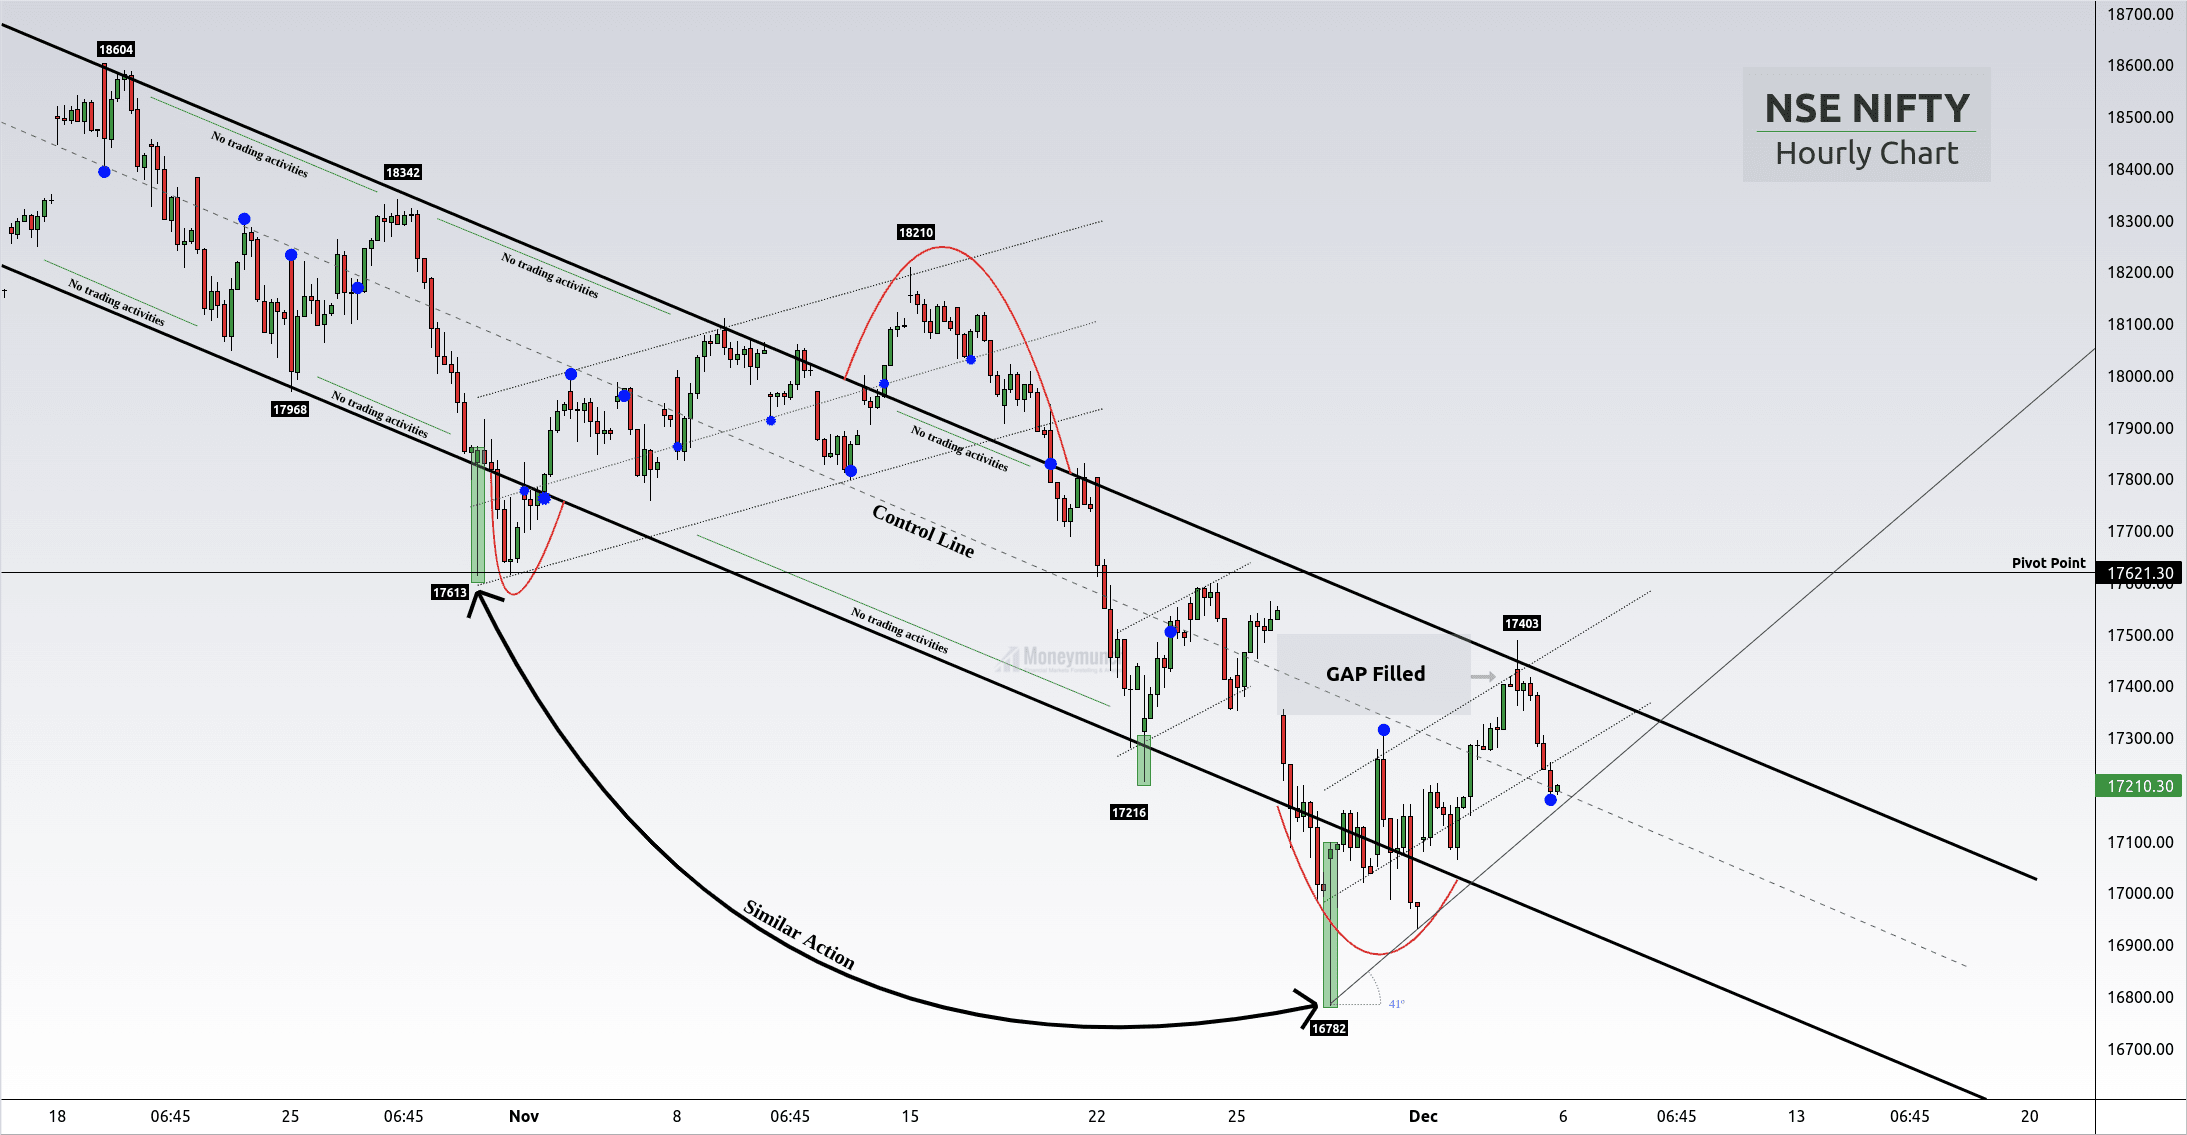
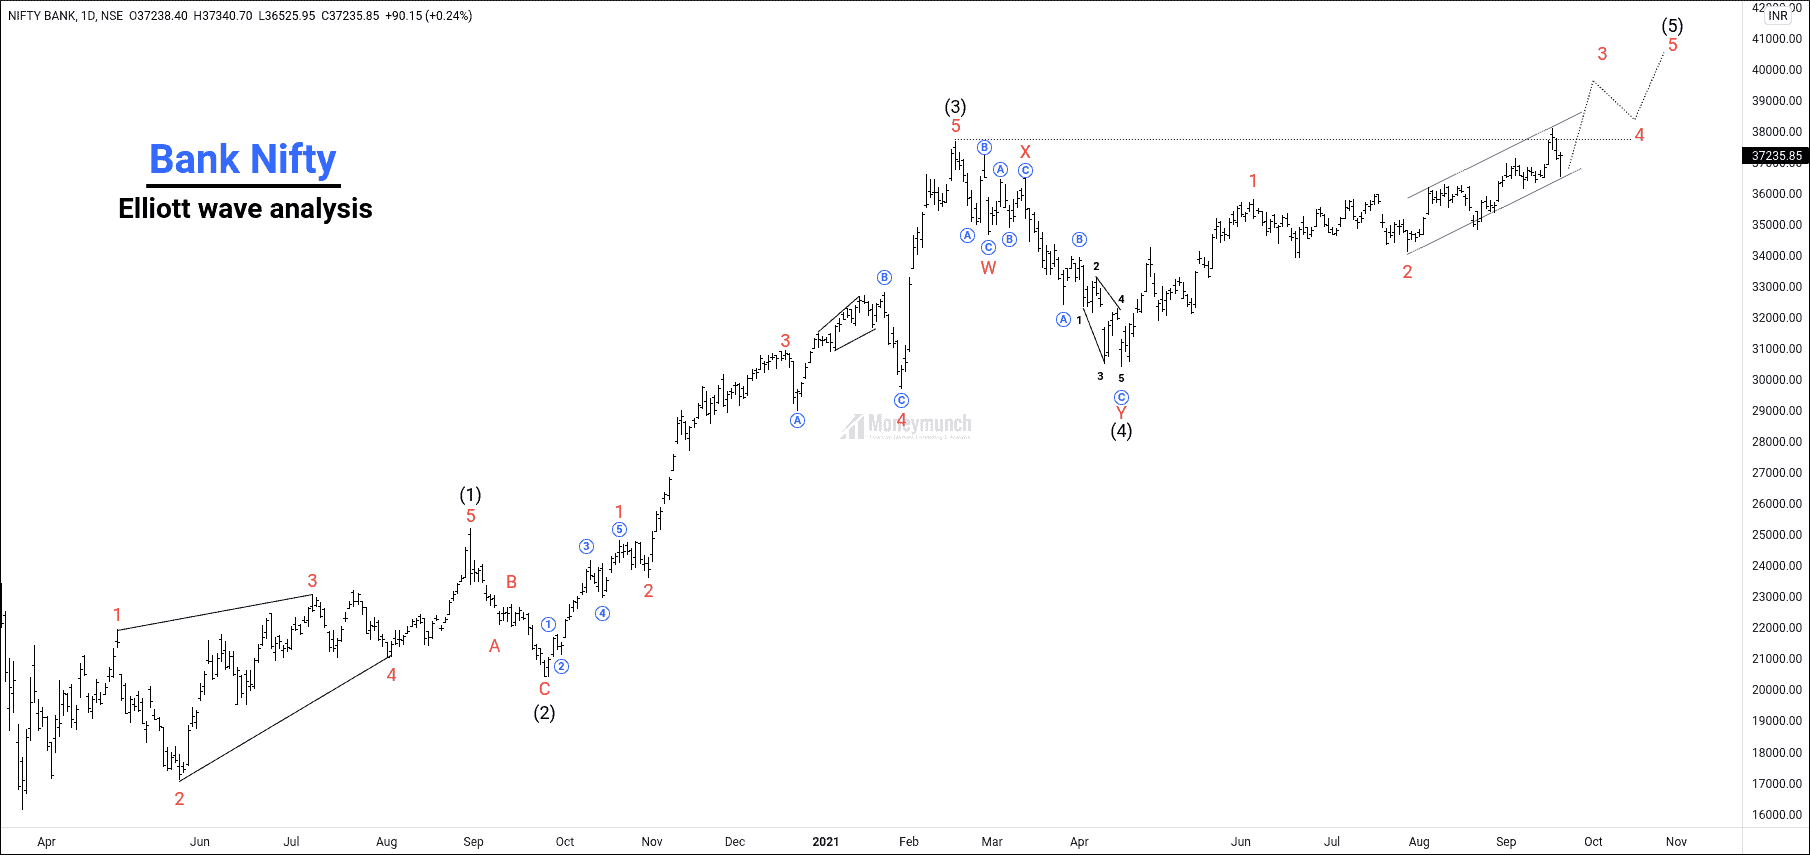
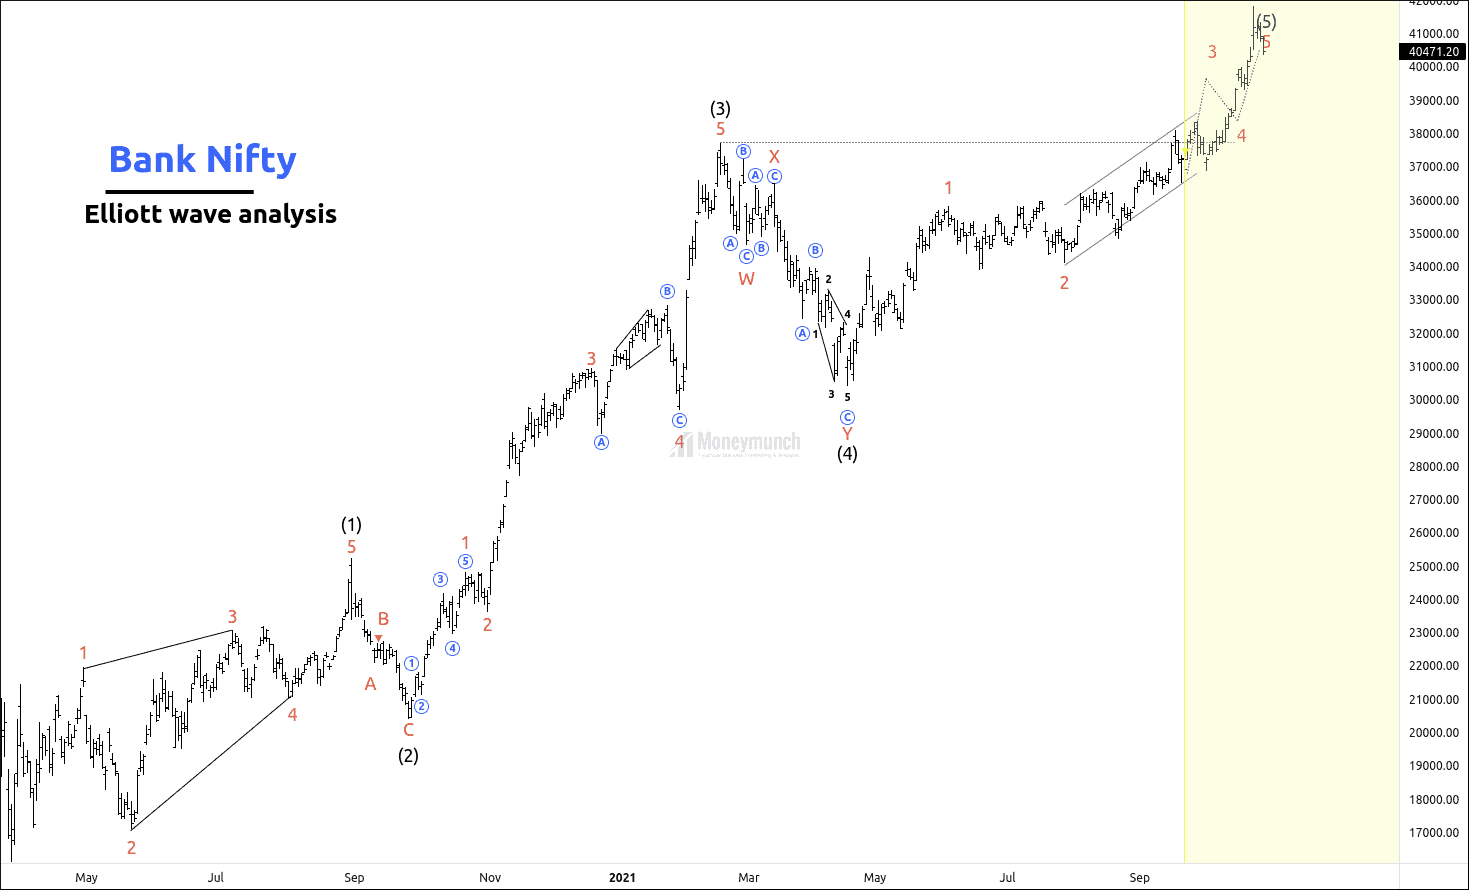
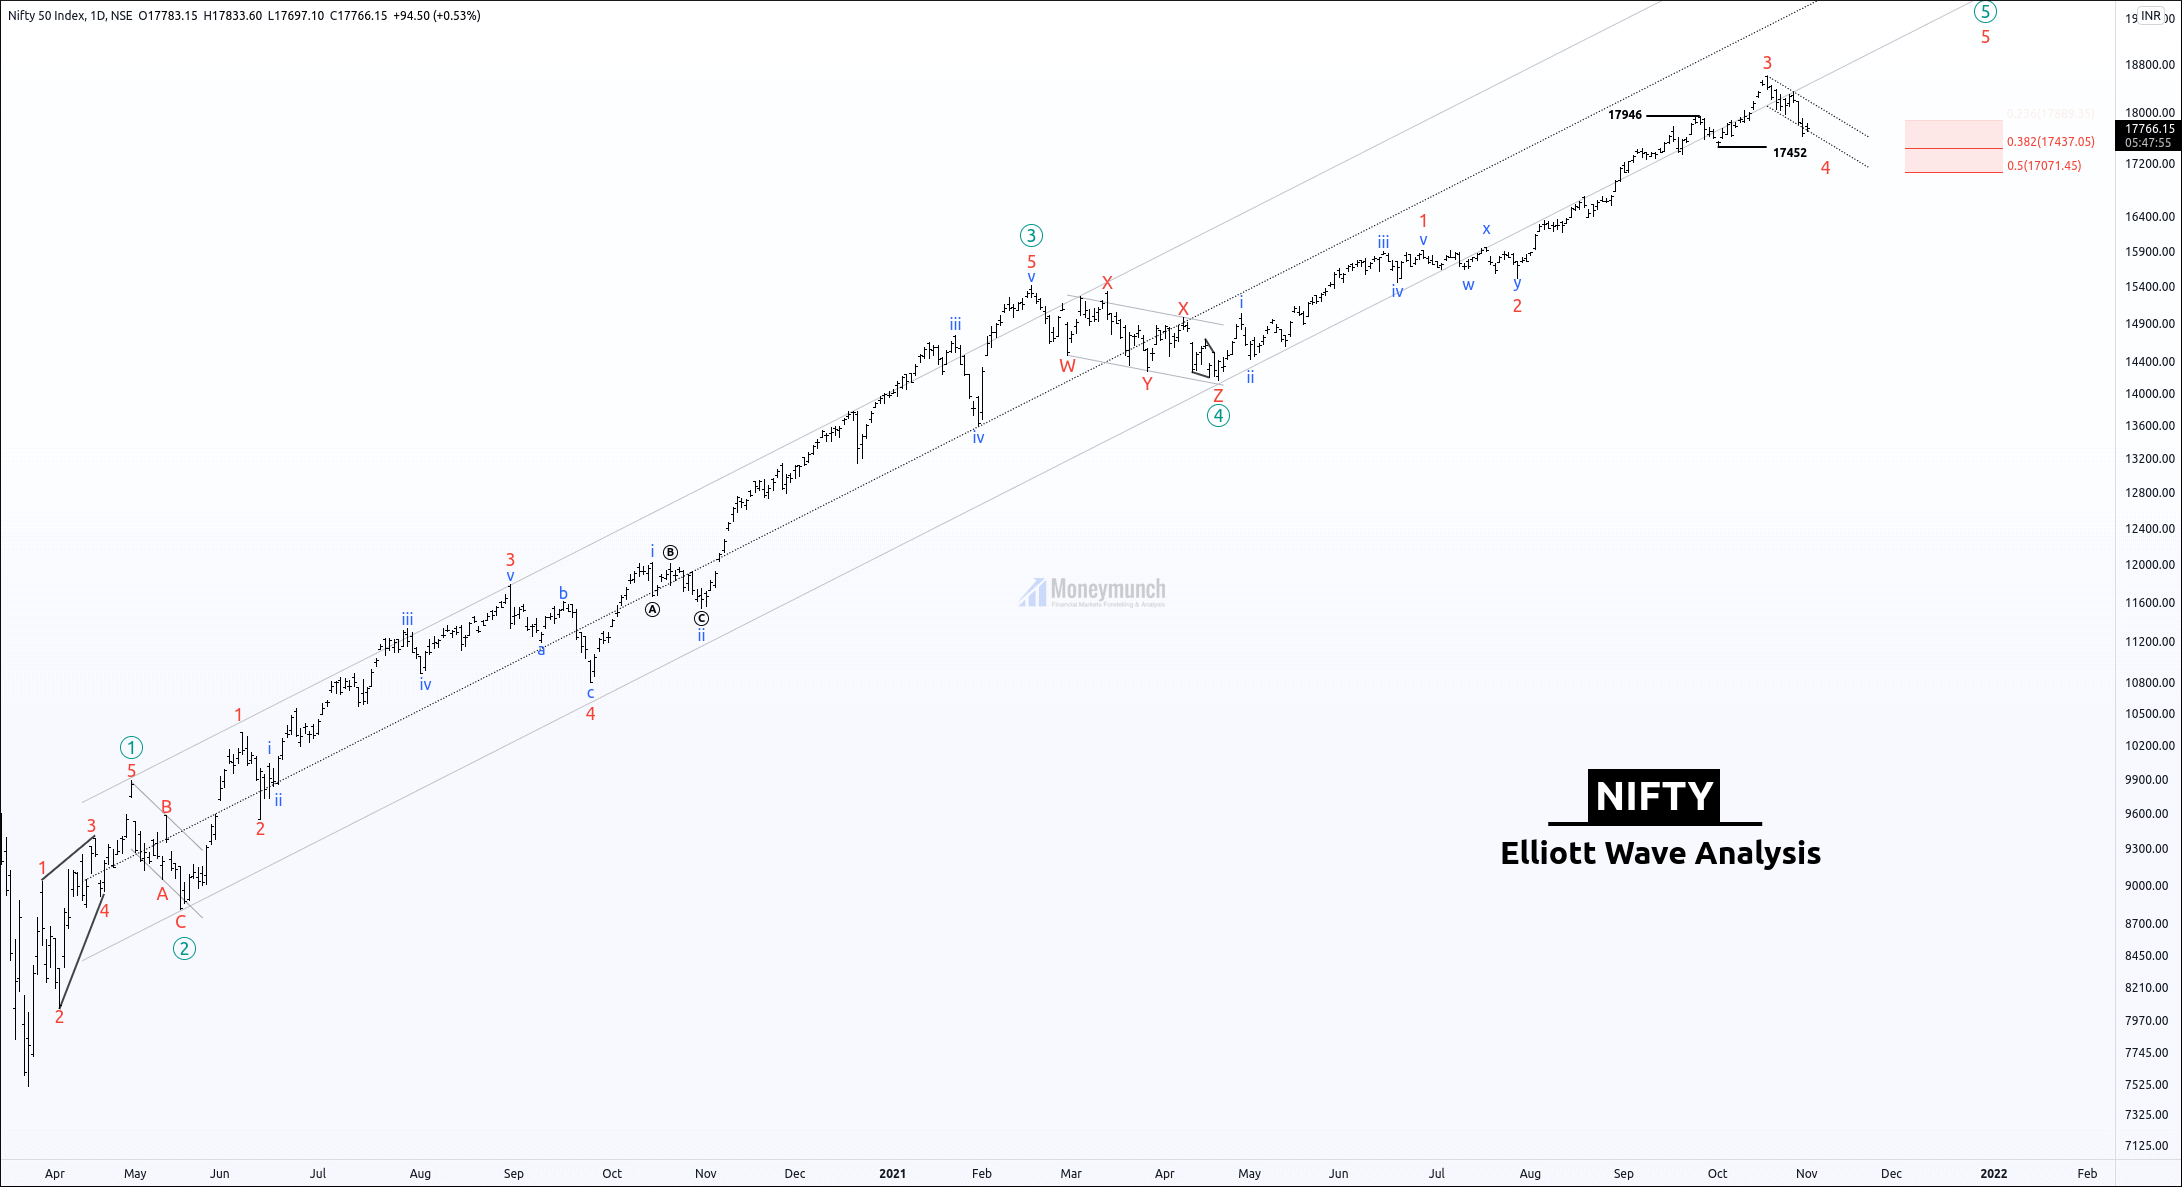
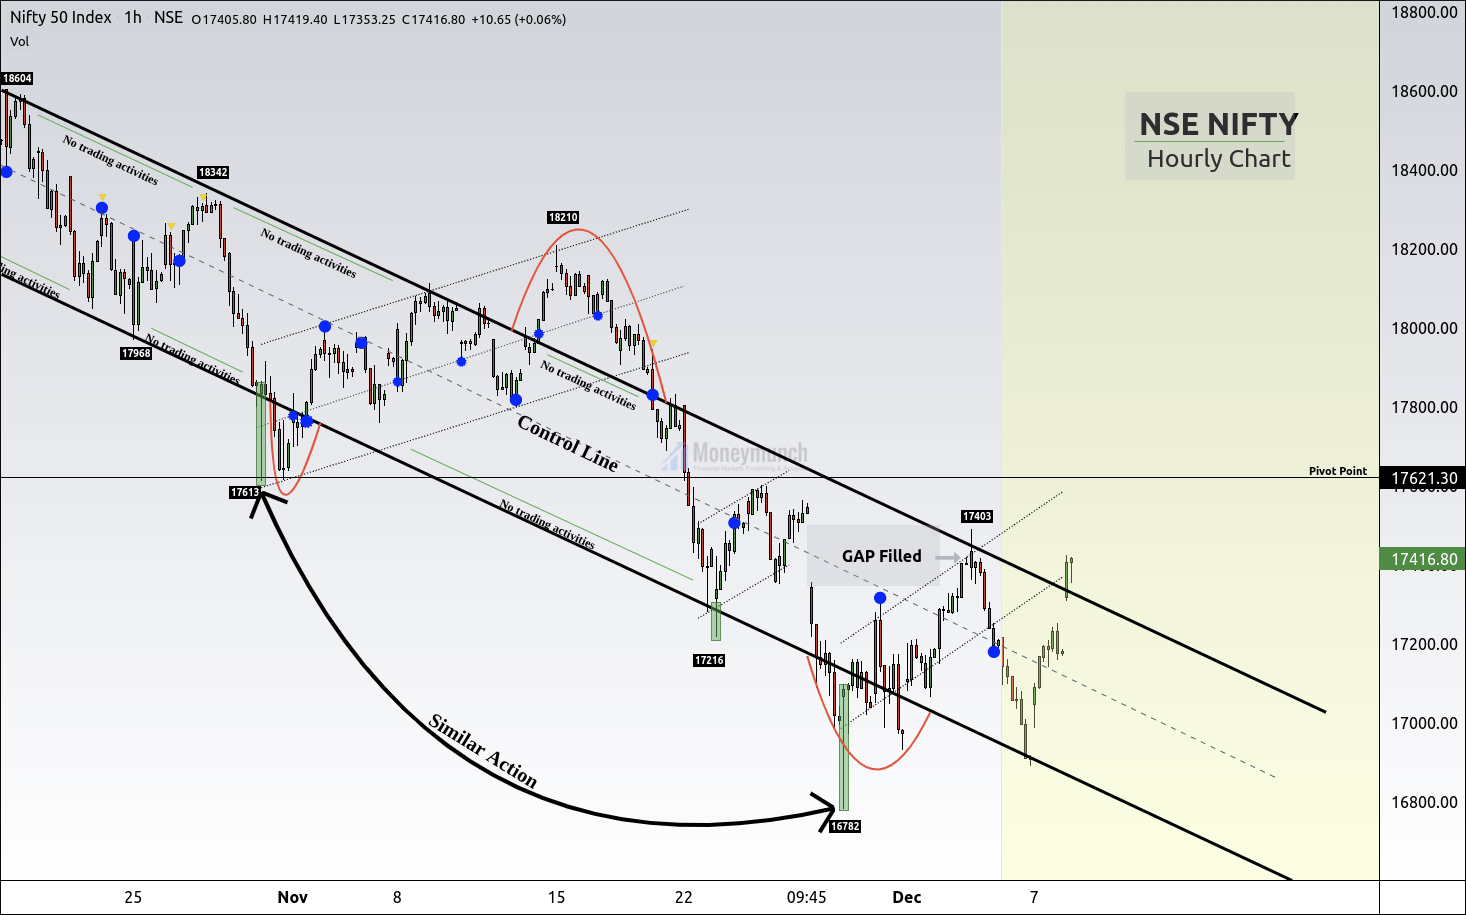
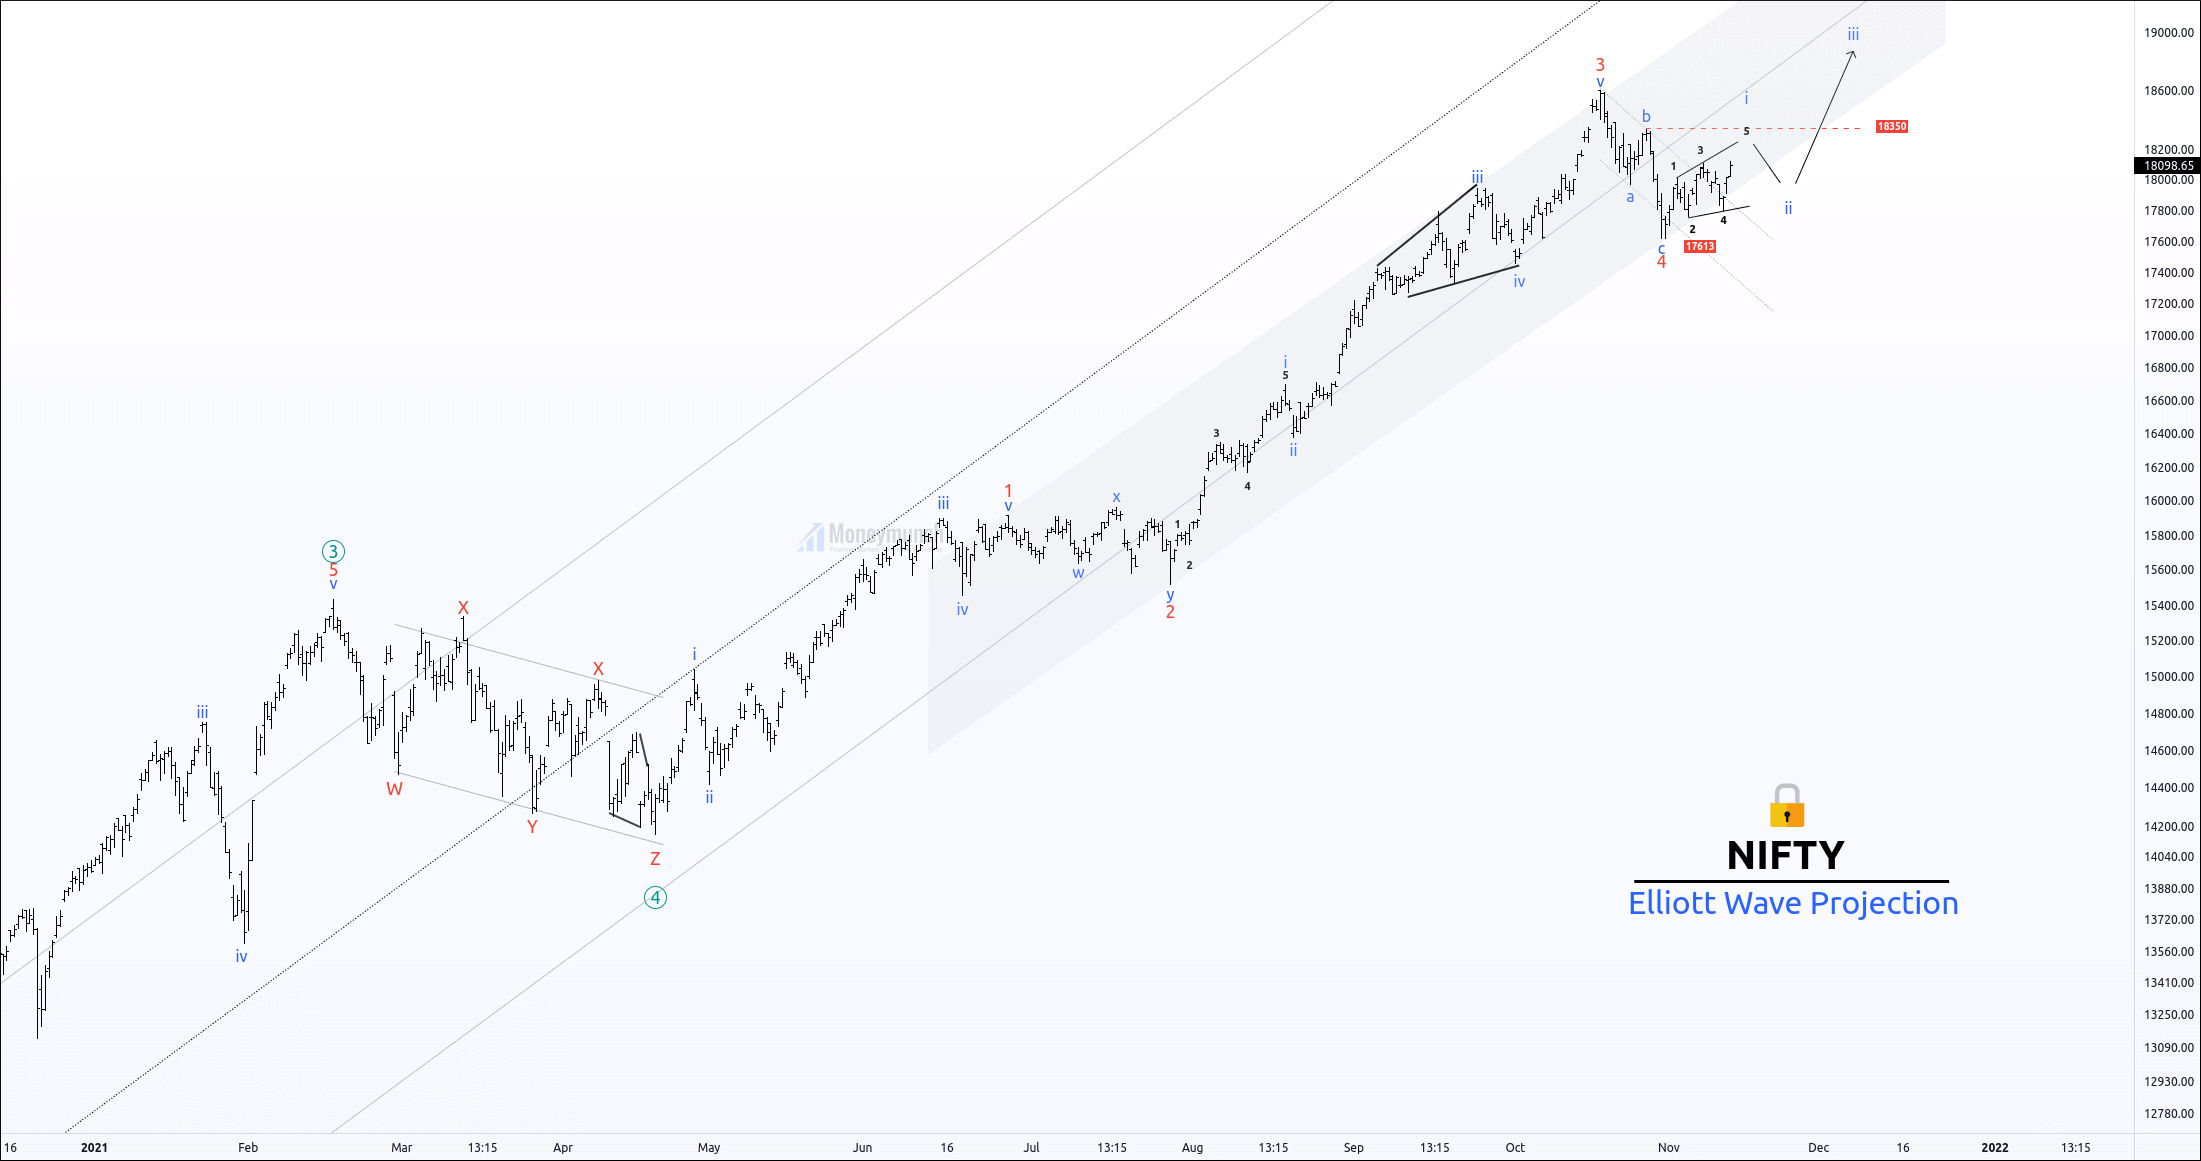
Nifty is performing under a parallel channel as described in the above chart. See the below chart to see what happens next.

free stock nse nifty chart tips updates

TODAY

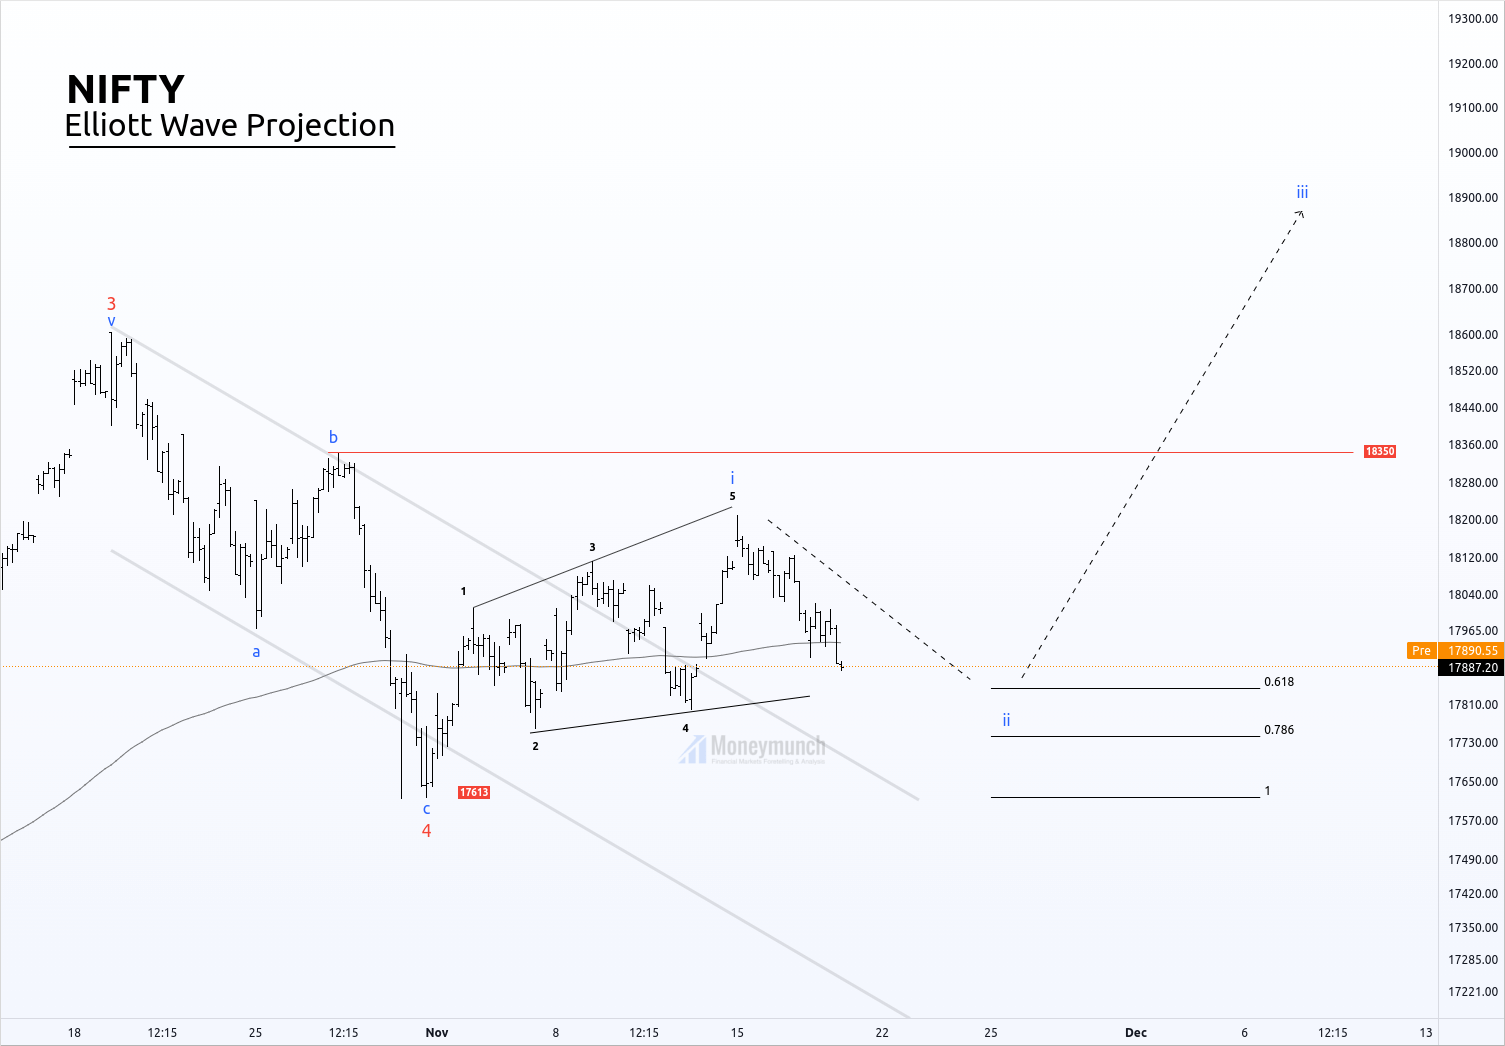
NEW UPDATE: So now, what’s next in Nifty?

nse nifty chart calls today

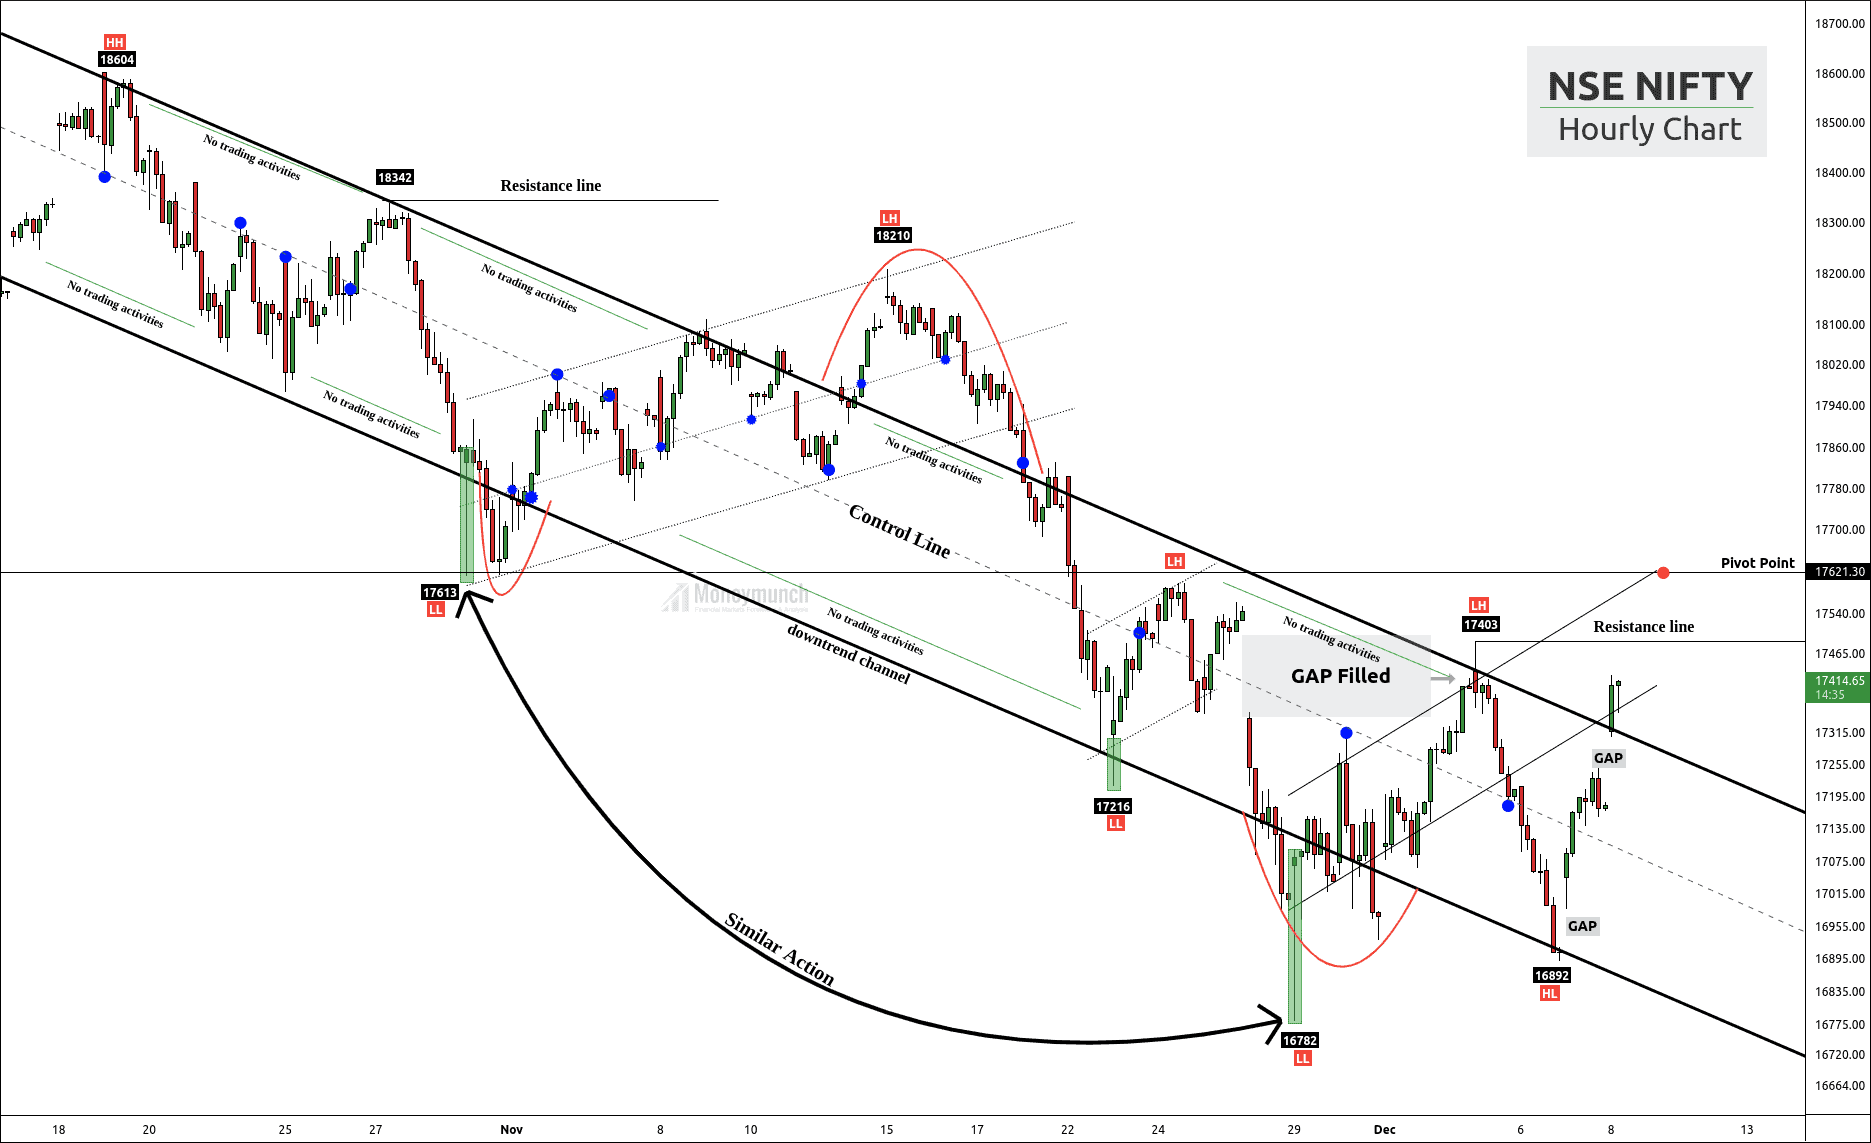
Nifty has completed the law of similar action. It has broken the corrective channels and touched the lower band at 16892. Price has faced support on the lower band and responded with demand by touching the upper band.

At this time, the price is out of the downtrend channel.

In my previous idea, I have mentioned that if the price can’t break the pivot point, there are high chances of price excess.

Our nearest lower high (LH) is 17403, which may react as a resistance.

In a nutshell, if nifty breaks the pivot at 17621, there are higher chances of the trend changing. Before reaching the pivot point, it has to break the resistance line.

Failure will be the cause of excess. To become a subscriber, subscribe to our free newsletter services. Our service is free for all.

Continue reading

Nifty Today: The Case Of Initiative And Response Between Bulls & Bears

free nse nifty hourly chart tips

Nifty has continued forming the descending channel. Price has made three excess areas on the lower band. It means that bear traders are continuously trying to break down the descending channel. Price is following the control line with nine spot confirmation. The trend will change after a breakout of the upper band, and it will drag the nifty price at my pivot point. And that pivot point will act as a hurdle. Hence, it has to climb up to that. And if that happens, then it will keep moving forward non-stop. Otherwise, there is Continue reading

NIFTY’s Elliott Wave Perspective for Today

free nse nifty stock tips daily chart

Nifty can bounce from 0.618%0.786% of retracement levels, and we may see 18350 again.

According to the Elliott Wave Principle, it can drop up to 1.00% of wave i. And a breakdown of wave ‘i‘ is a direct sign of a strong downtrend.

Buyers must note that the price has broken 200 EMA.

To become a subscriber, subscribe to our free newsletter services. Our service is free for all.

Continue reading

Nifty Can Take Two Steps Back Before Skyrocketing

free nifty fut stocks tips & chart

This week nifty may break 18350, and this level will increase high buying pressure.

The above chart shows that nifty seems price is forming a leading diagonal. Moreover, wave 5 is the ending point of the leading diagonal.

And completion of wave ‘i’ the wave ‘ii’ will take place. The wave ‘ii’ is corrective. So the day traders can initiate buy position there. It’s a golden opportunity because of moderated risk here.

Safe intraday traders can enter at the breakout of wave i. This point is also initiating an opportunity. If the acceleration phase is sturdy, then It can hit 19200.

Please note that wave ‘2’ can never overlap the starting point of wave ‘1’.

To become a subscriber, subscribe to our free newsletter services. Our service is free for all.

Continue reading

A Complete Report of the Bank Nifty

Before I start, I recommend you to read the following article:
Is Bank Nifty Forming An Ending Diagonal? (September 21, 2021)

Wherein you can find Elliott Wave projection on Bank Nifty daily timeframe’s chart. See below chart:

free nse bank nifty daily chart tips

Has Bank Nifty concluded the 5th wave by making a high of 41829.6? Look at the below chart:

free nse Bank Nifty results & tips

Bank Nifty price is trying to shift at the support trendline of mid-April to June.

  • Has it created A (A B C correction) by making a low of 38426.65?
  • Or is it the sub-wave (4) of wave 4?

Look at the below chart to find correction possibilities:

To become a subscriber, subscribe to our free newsletter services. Our service is free for all.

Continue reading

Last Warning to NIFTY Sellers

free nse nifty daily chart tips

Nifty is forming corrective wave 4 of wave ((5))

Nifty has made a high at 18604 and started falling due to conclude of wave 3.

It has broken the base channel due to high selling pressure on Nifty.

The following terms confirm the nifty pullback.

  • The common Fibonacci retracement of wave 4 is 38.2%. Nifty has entered the 38.2% retracement level. It seems like the reversal is ahead.
  • Wave equality (A = C)
    Wave C is 100% of wave A and vice-versa. If nifty breaks the previous low, then it can reverse between 100% to 161.8% range.

The corrective wave can complete if it sustains in the channel trendline.

To become a subscriber, subscribe to our free newsletter services. Our service is free for all.

Continue reading