In the previous article, I have mentioned the weakness or gap down. Yesterday, nifty opened in a gap-down of 219 points.
Click Here: NIFTY OUTLOOK: IS NIFTY PREPARING FOR 16800?
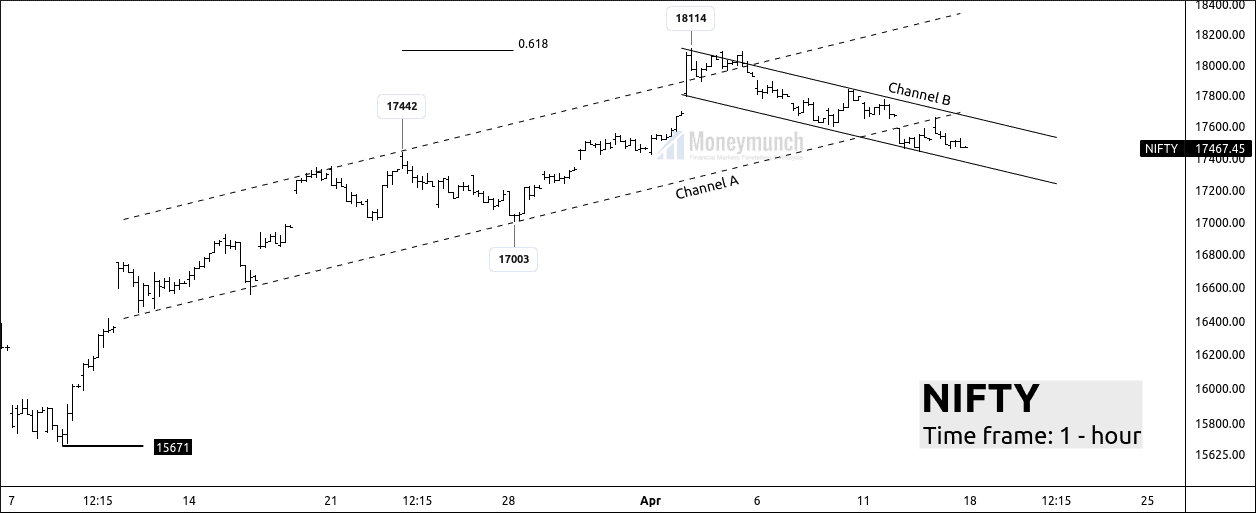
NIFTY
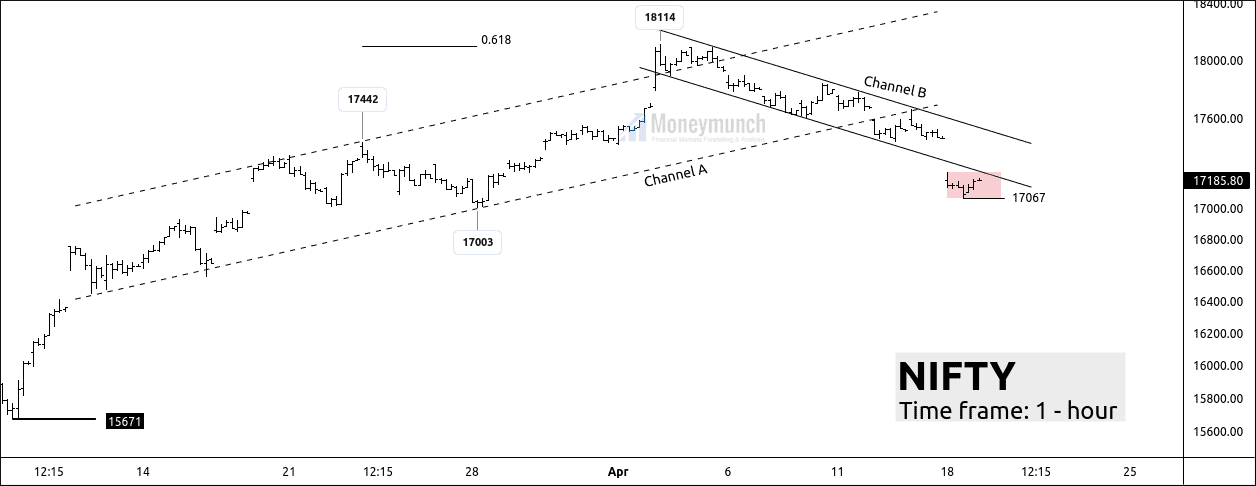
Today, we can expect a pullback to the current move, which will go up to the upper band of the B channel.
Nifty has broken down the lower band of channel B.
If the price beaks face resistance at the lower band, the price may fall for the support level 17000 – 16912 – 16800.
The key level for the up move is 17250. If the price sustains above the 17250, traders can expect resistance levels: 17300 – 17425 – 17466.
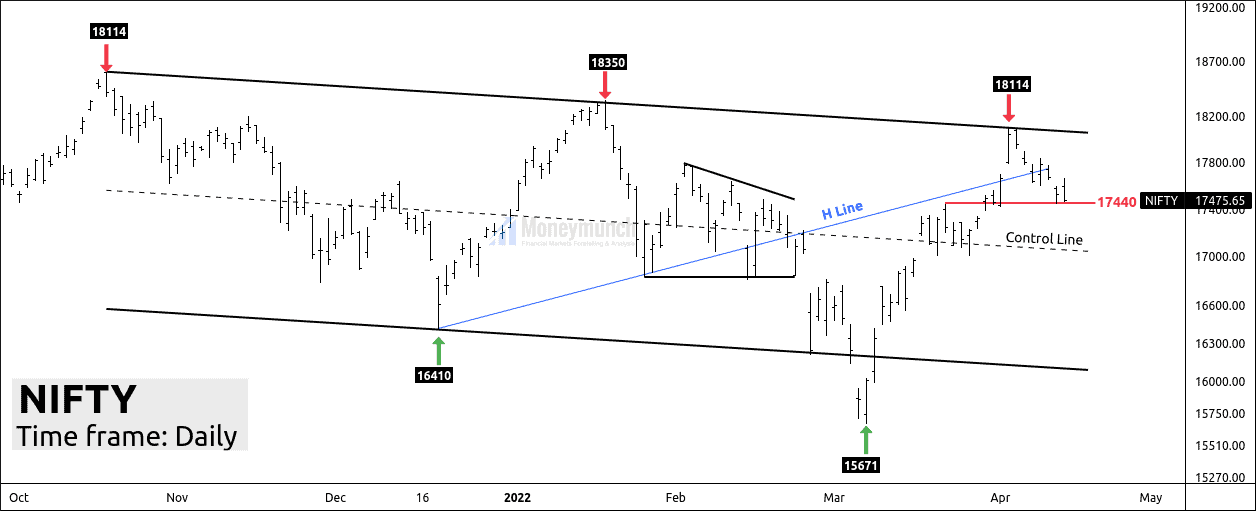
Don’t forget trend never moves in a straight line. It creates lows and highs. The bull trend can only be possible during the breakout of 18121.
BANK NIFTY
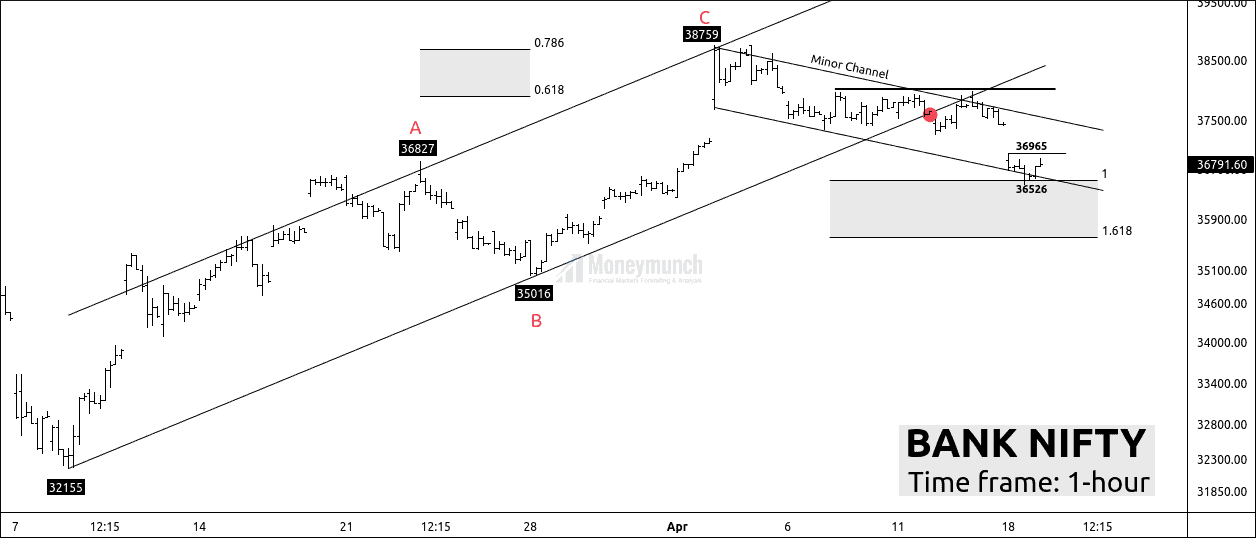
Bank Nifty has completed the zigzag pattern at 38759 with 0.786% Fibonacci extension. This down move has also broken down the ABC channel.
The market never stops its cyclical move. Yesterday, Bank nifty touched the lower band of the minor parallel channel. Nifty had made the range between 36965 & 36526
If the price respects the parallel channel, traders can expect a good up move to 37150 – 37251 – 37315
If the price breaks down the parallel channel & sustains below 36500, it will be a bearish signal because 36500 is a pivot level.
However, the assumption of a positive day can be possible as the global market is +ve.
To become a subscriber, subscribe to our free newsletter services. Our service is free for all.
 Unlock This Article