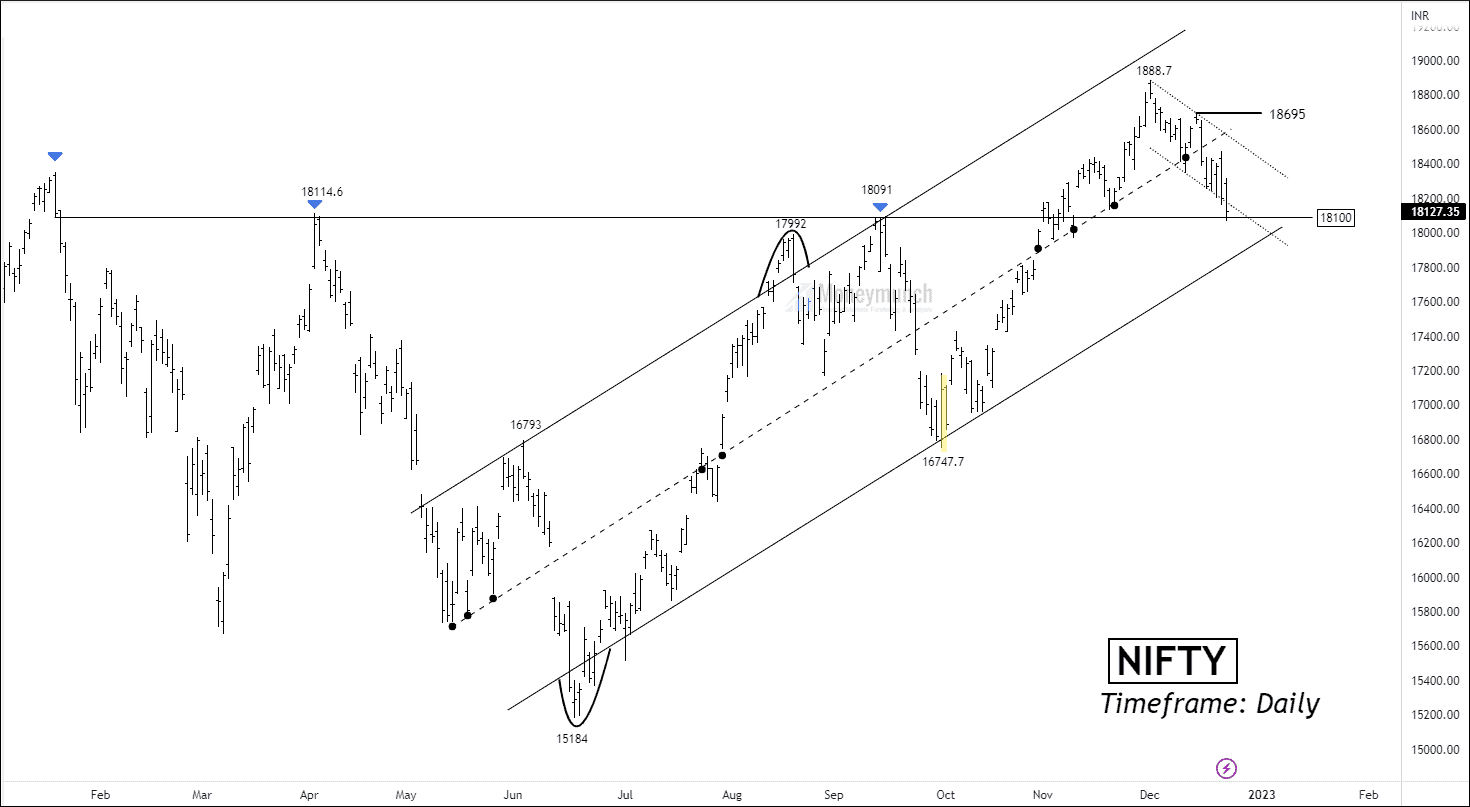
Yesterday, We published Elliott Wave analysis on NIFTY 50.
Visit here: NSE NIFTY – Elliott Wave Projection
NSE NIFTY Update For Subscribers
 Continue reading
NSE NIFTY – Elliott Wave Projection
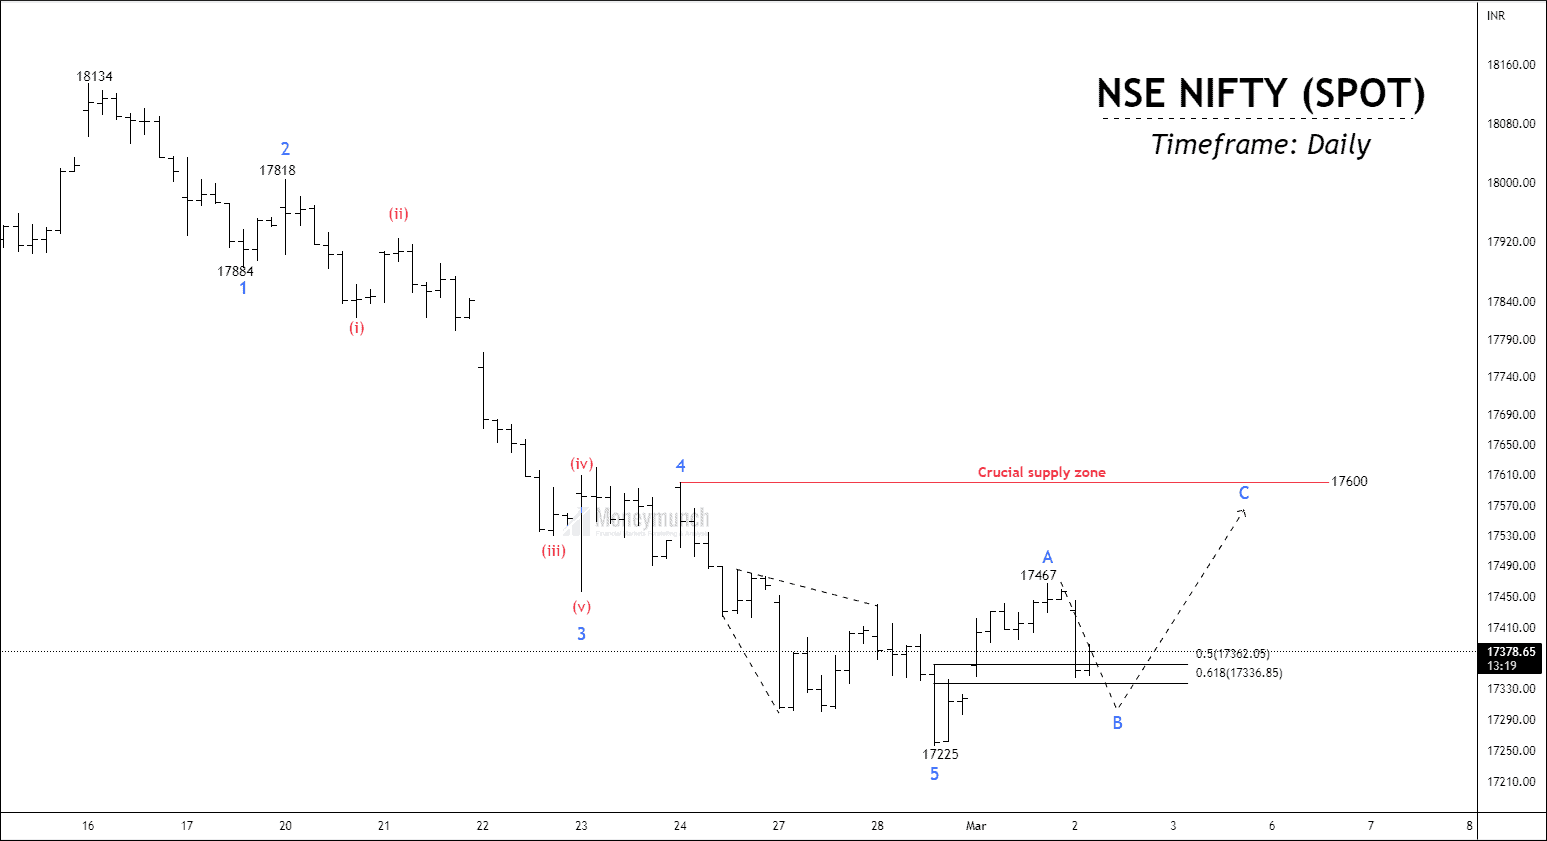
Timeframe: Hourly
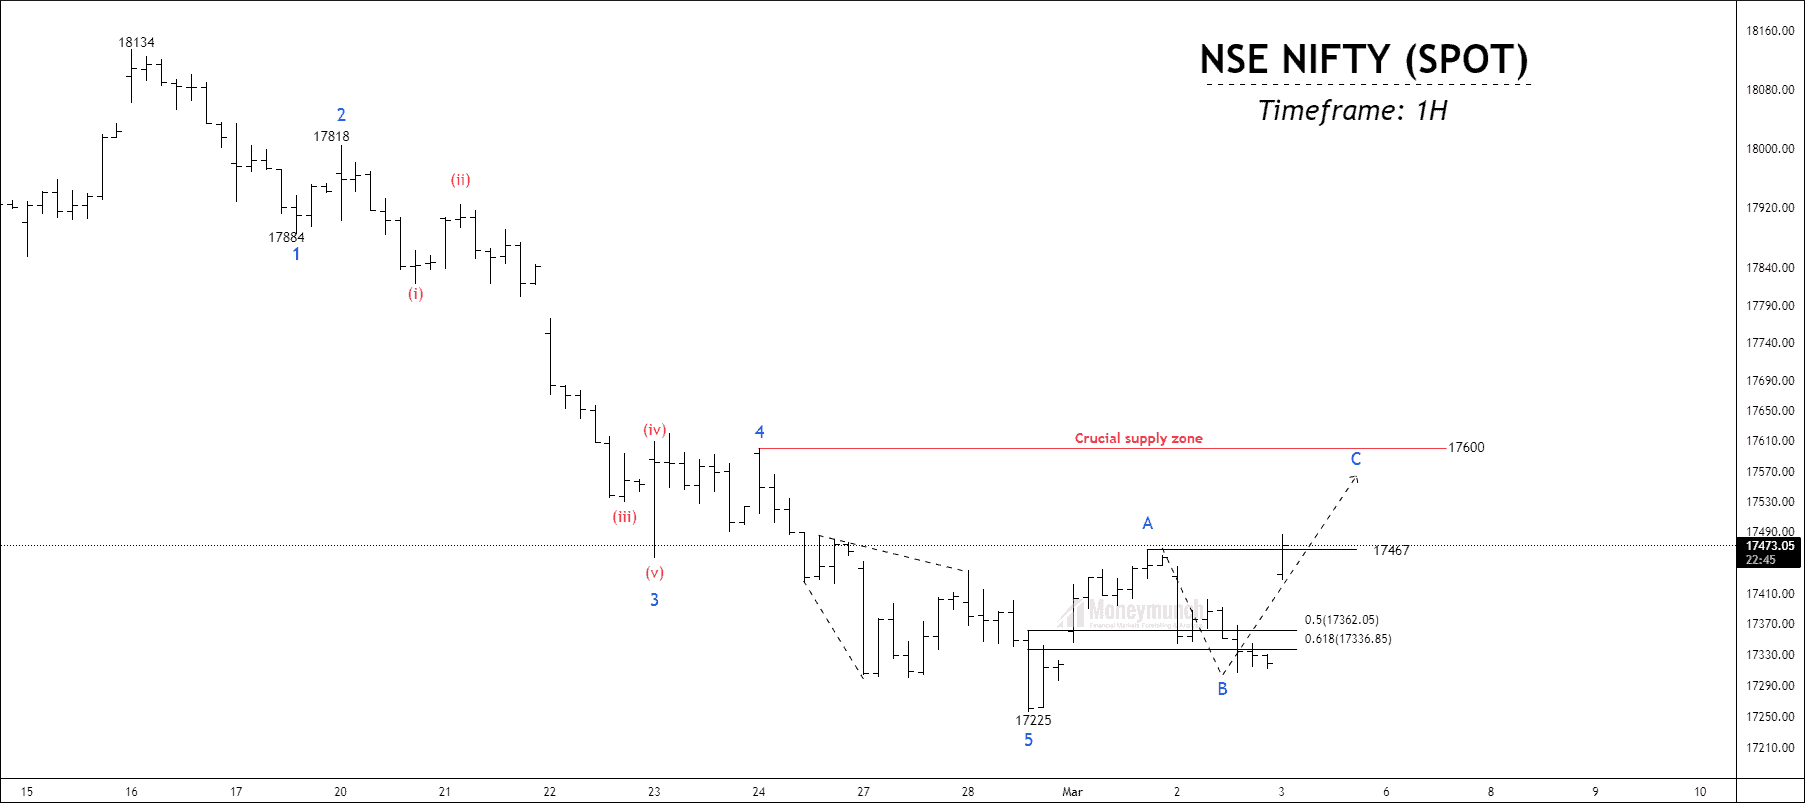
The Nifty is stuck between supply and demand. Bulls will not break 17300, and bearish won’t break 17600. The complexity of the move has confused retailers too. Per the hourly timeframe chart, the price has accomplished a short-term impulsive cycle and started forming a corrective process before a steep fall. Wave A of this corrective cycle has been completed at 17467, and Wave B is currently in formation. Price retraced 61.8% retracement.
Upon completing wave B, and sustaining above 17300, the price can move up to the next resistance level of 17600. This level indicates strong resistance, and failure of sustention will increase supply rapidly and may form a new low too. The Nifty is moving near the 200 EMA on the daily timeframe chart, and the ATR is 182.7.
 Unlock This Article
Only subscribers can read the full article. Please login to read the entire article.
Continue reading
EWT – NSE NIFTY Trade Setup For Subscribers
Only subscribers can read the full article. Please login to read the entire article.
NIFTY Research Report – Were Bears Bullish?
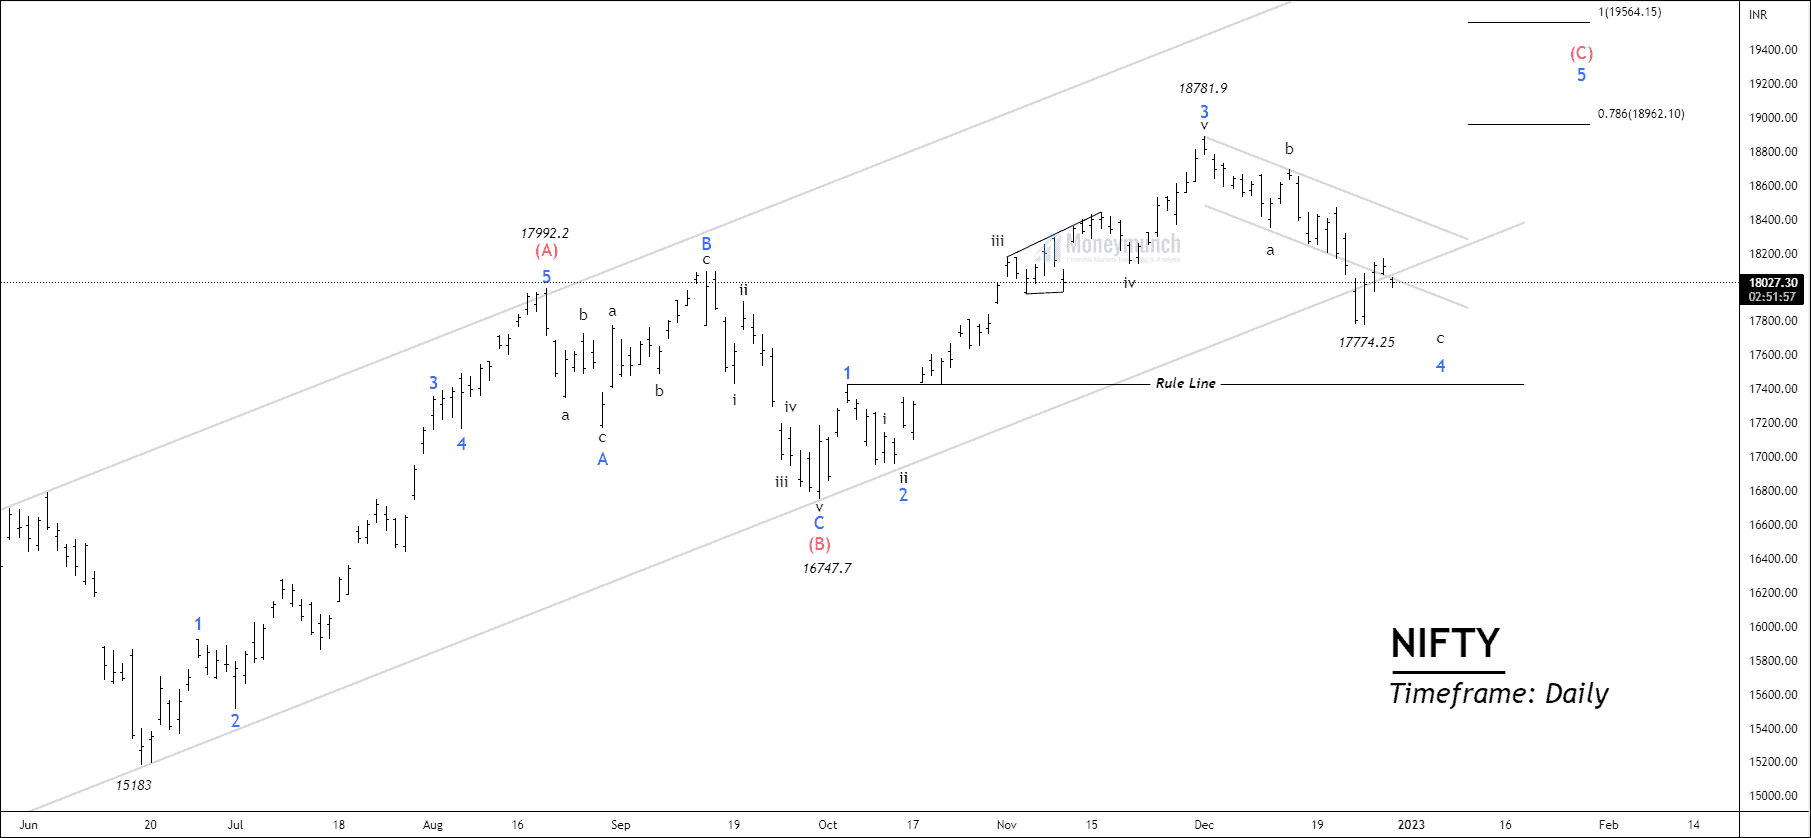
We already uploaded wave analysis & price action analysis where I talked about a bearish wave C. The level of 18100 was crucial support for the nifty 50, and the price made a low of 17774.25. We were able to grab the move.
This report will be a broad analysis with multiple timeframes and scenario analysis. So, here we are with the same question! Is correction deep enough? If we can find the ending point of corrective waves, we can ride on an impulse.
 Continue reading