Timeframe: Hourly
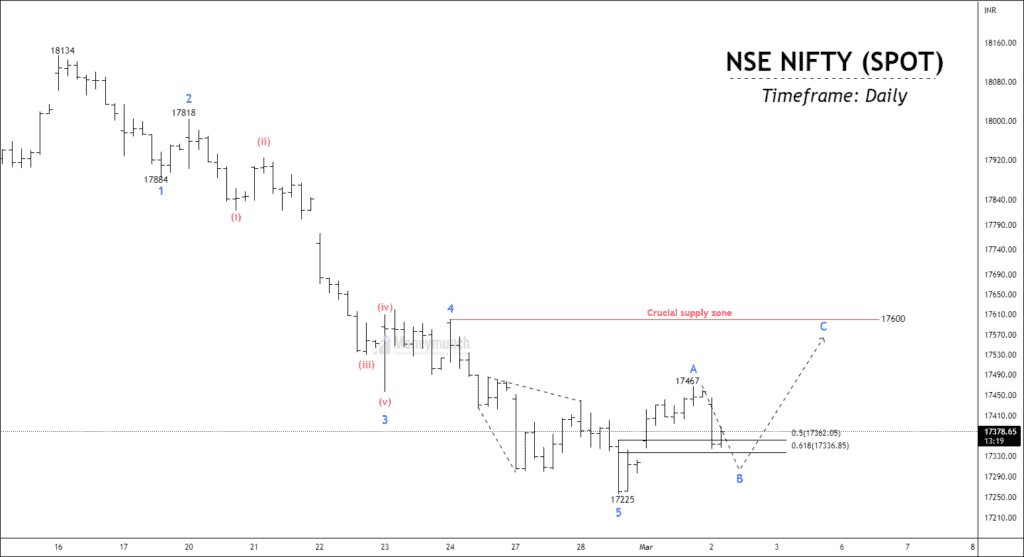
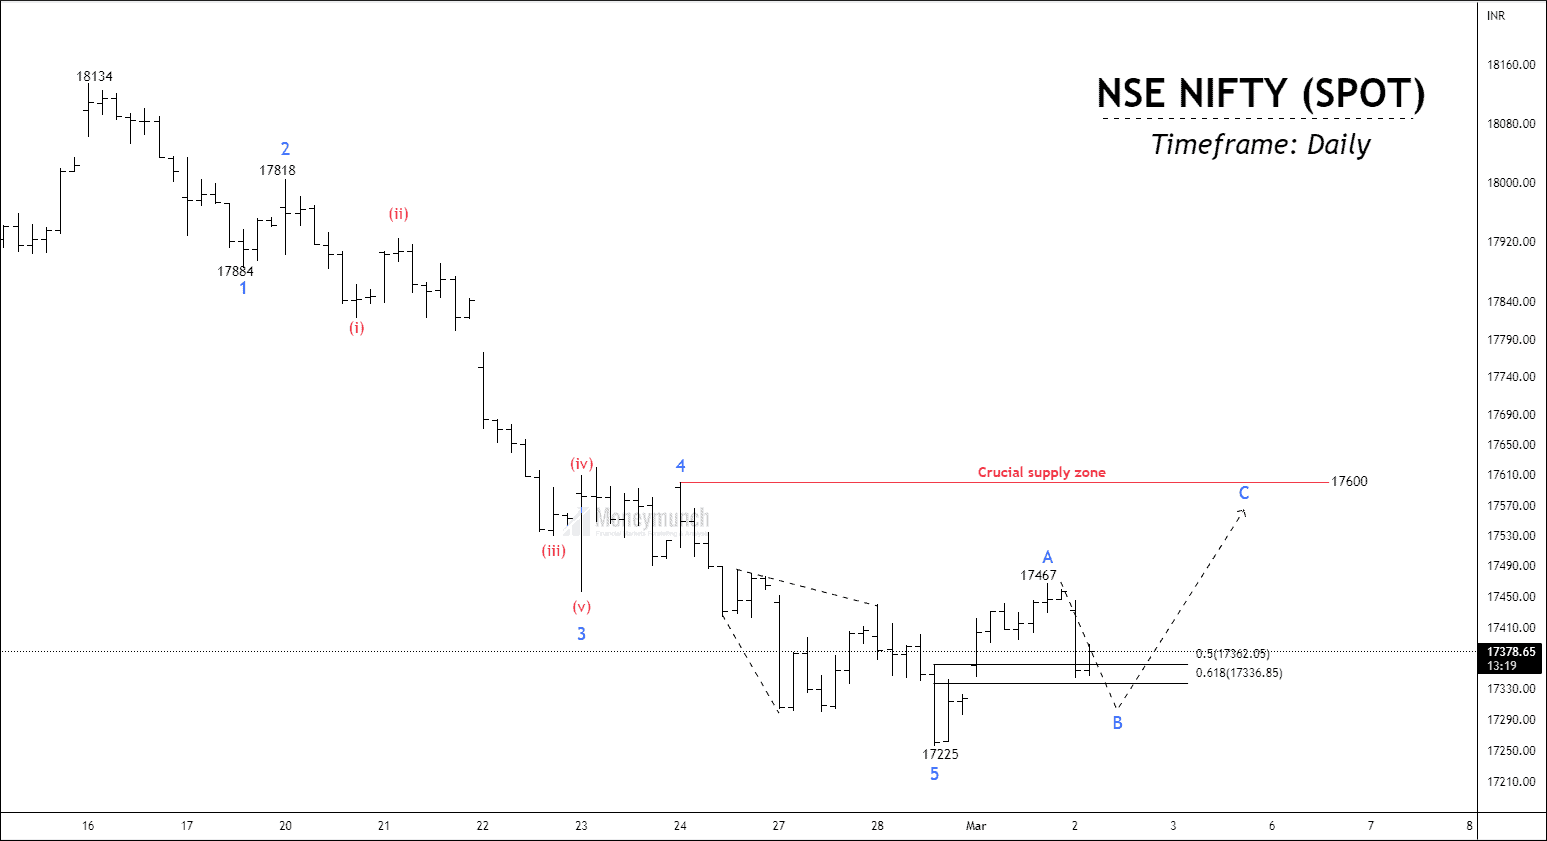
The Nifty is stuck between supply and demand. Bulls will not break 17300, and bearish won’t break 17600. The complexity of the move has confused retailers too. Per the hourly timeframe chart, the price has accomplished a short-term impulsive cycle and started forming a corrective process before a steep fall. Wave A of this corrective cycle has been completed at 17467, and Wave B is currently in formation. Price retraced 61.8% retracement.
Upon completing wave B, and sustaining above 17300, the price can move up to the next resistance level of 17600. This level indicates strong resistance, and failure of sustention will increase supply rapidly and may form a new low too. The Nifty is moving near the 200 EMA on the daily timeframe chart, and the ATR is 182.7.
 Unlock This Article
Get free important share market ideas on stocks & nifty tips chart setups, analysis for the upcoming session, and more by joining the below link: Stock Tips
Have you any questions/feedback about this article? Please leave your queries in the comment box for answers.