Trading Levels For 3 August 2023
 Unlock This Article
Only subscribers can read the full article. Please login to read the entire article.
Looking for reliable and free nifty intraday trading tips? Look no further than Moneymunch! We provide intraday and positional trading tips, technical analysis, research reports, and daily or weekly charts to help you make informed trading decisions in the stock market. Subscribe now and stay ahead of the game!
Have you traded the NSE NIFTY trade setup?
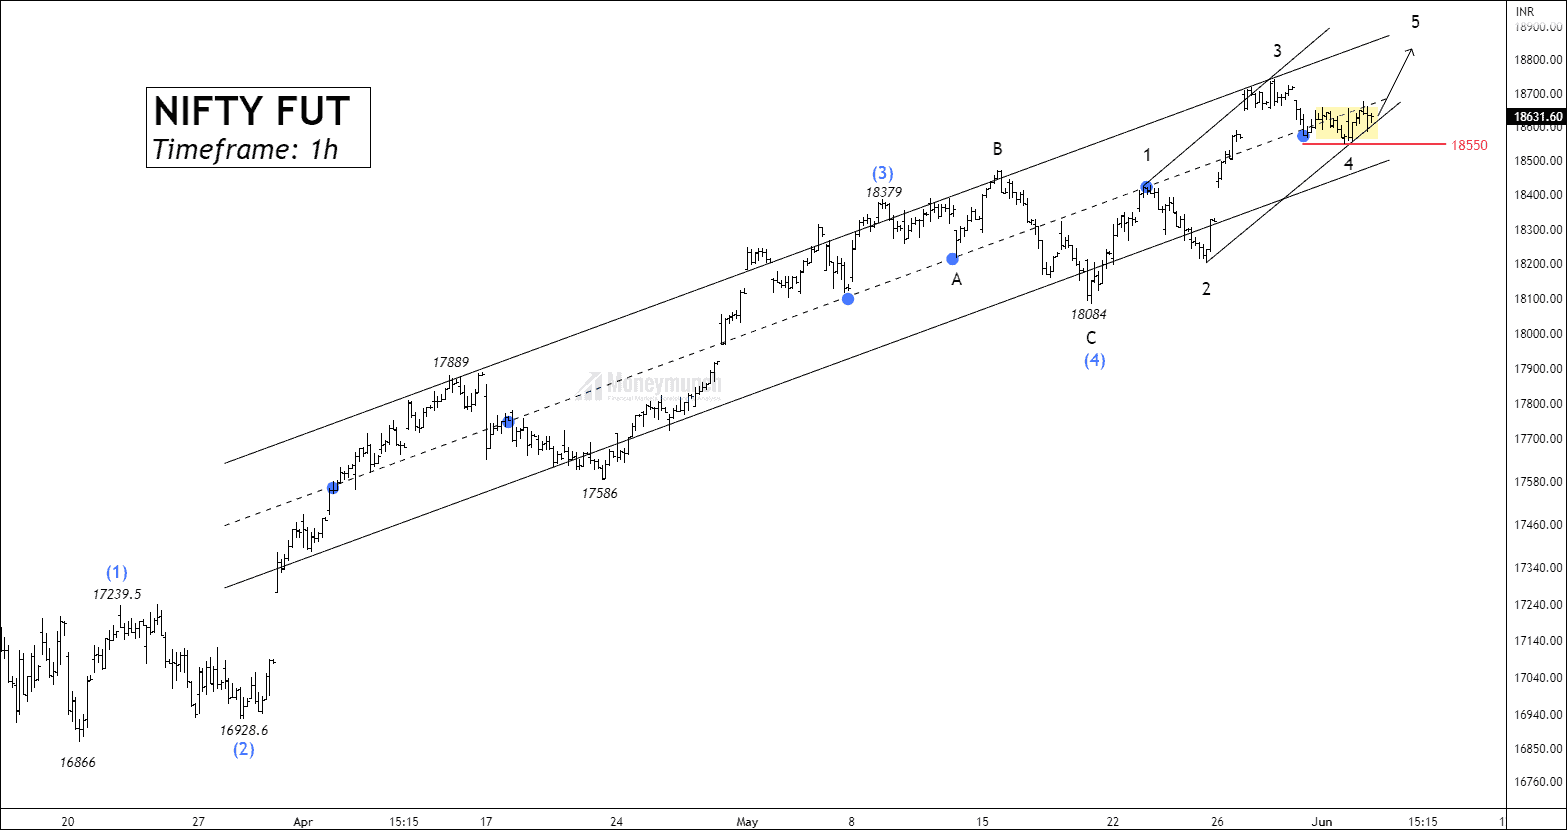
Visit here: NIFTY FUT – Equilibrium Is About To Be Disrupted
 BEFORE
Have you traded the NSE NIFTY trade setup?
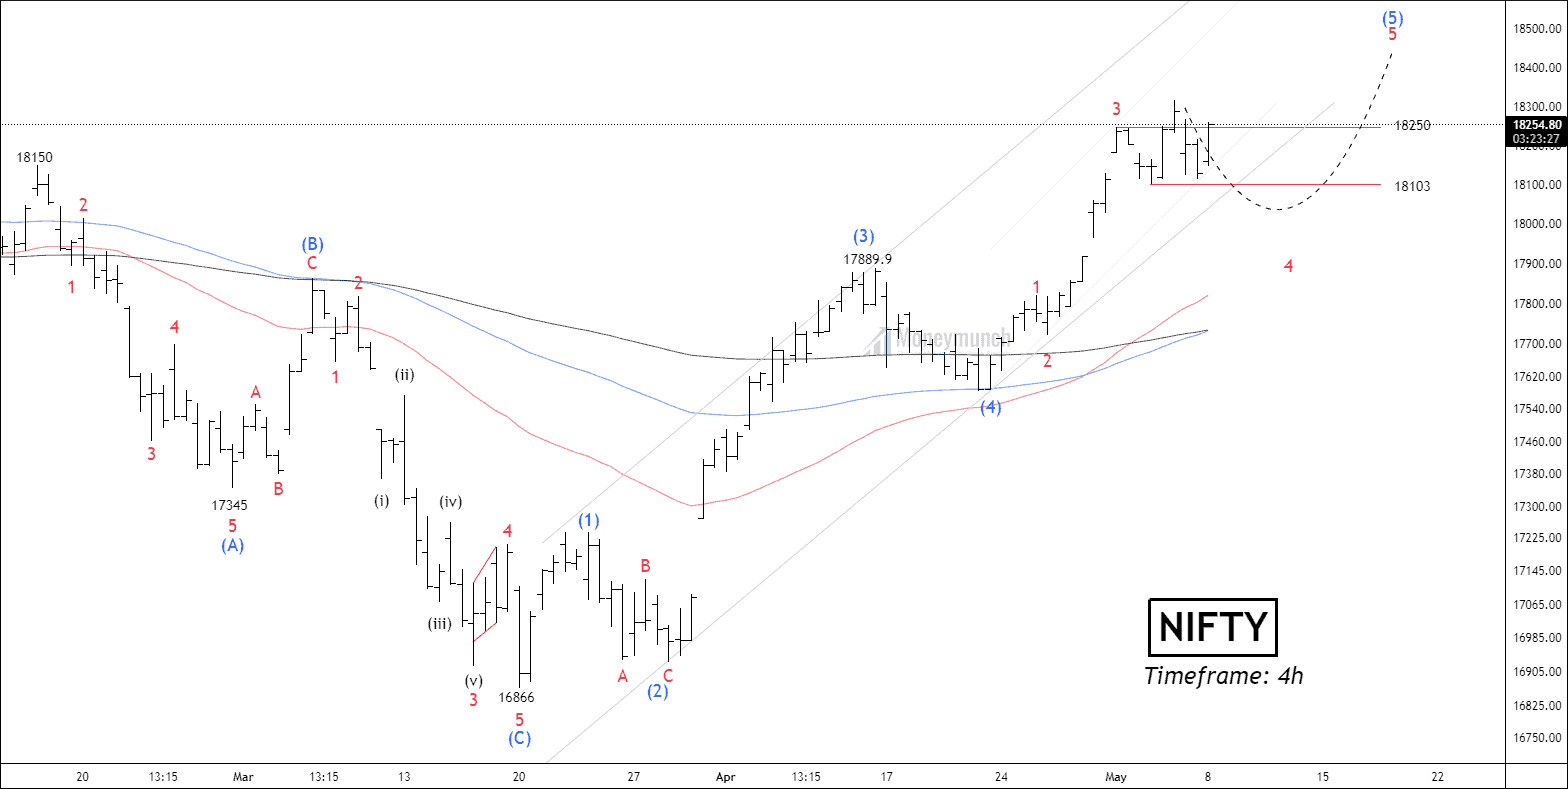
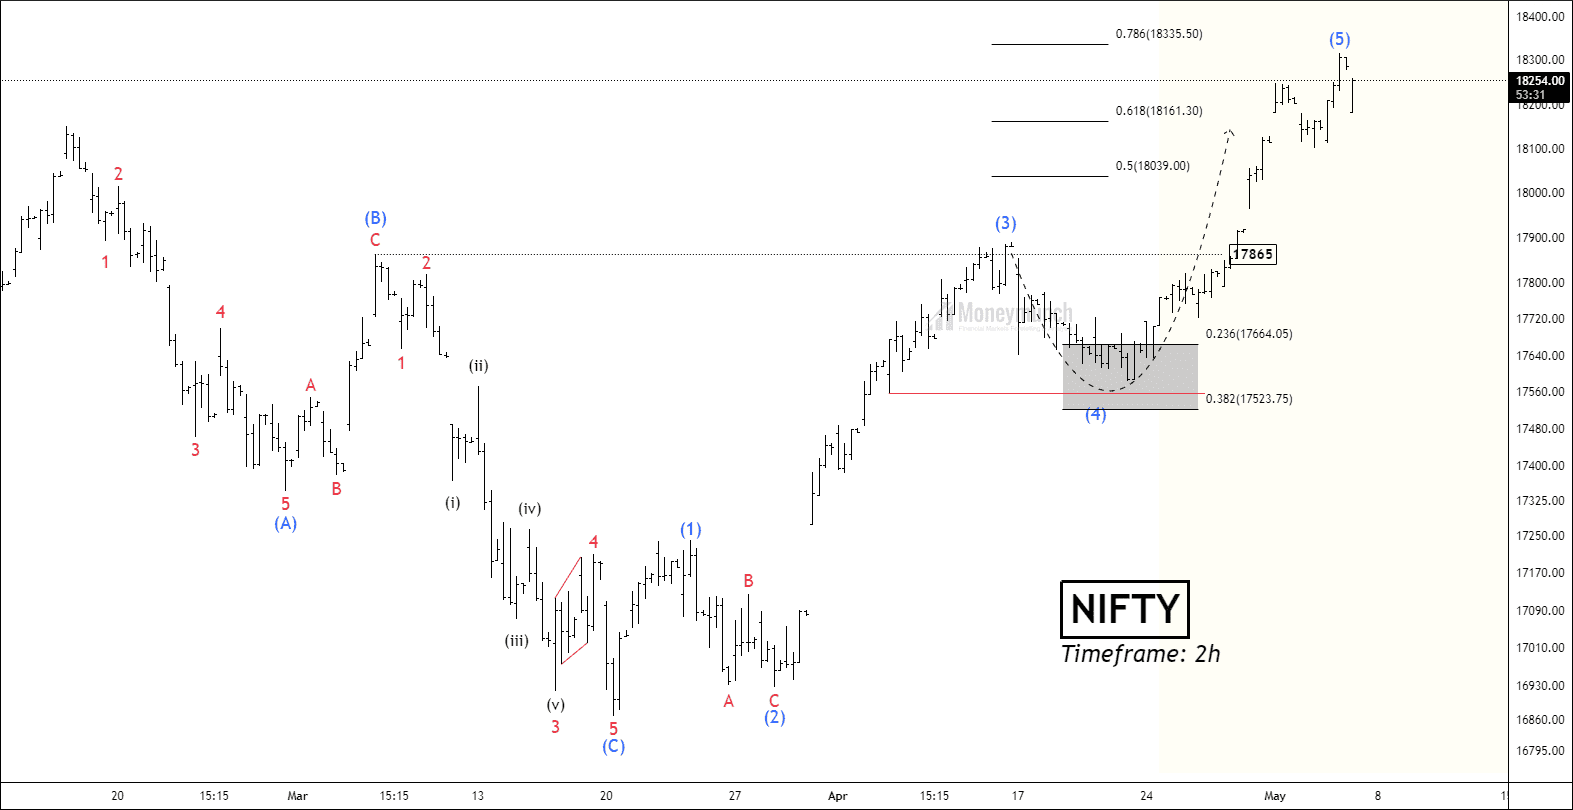
Visit here: NSE NIFTY – Elliott Wave Projection
 BEFORE
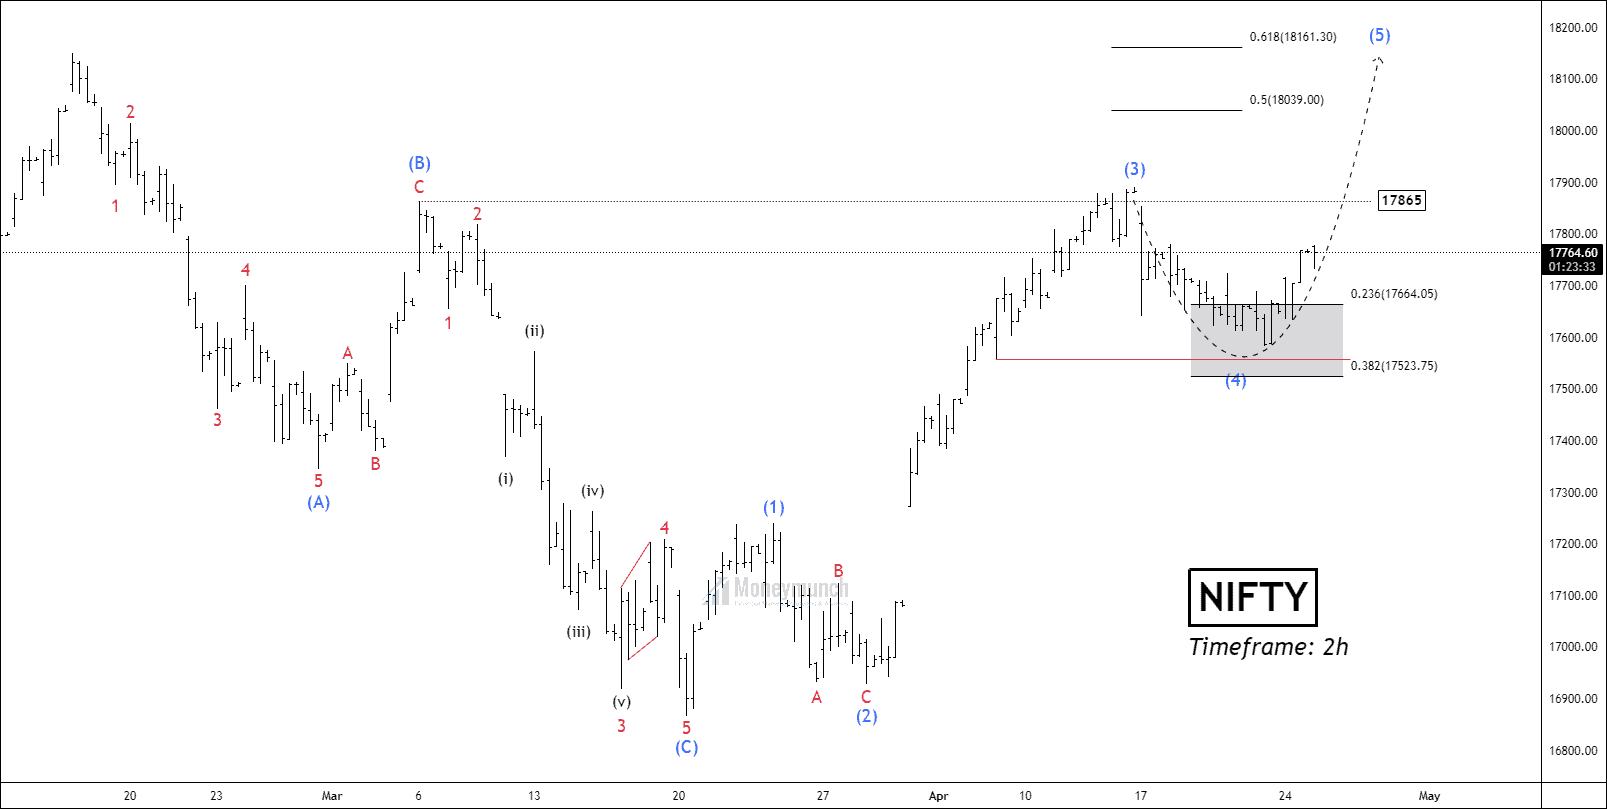
We had mentioned clearly to our subscribers, “If the nifty continues to sustain above the critical resistance level 17865, traders may consider buying positions for the following levels: 17981 – 18186 – 18292+.”
 AFTER
AFTER