IS MCX Natural gas is Preparing for A Skyrocket?
EWT – Is Natural Gas Prepared for a Reversal?
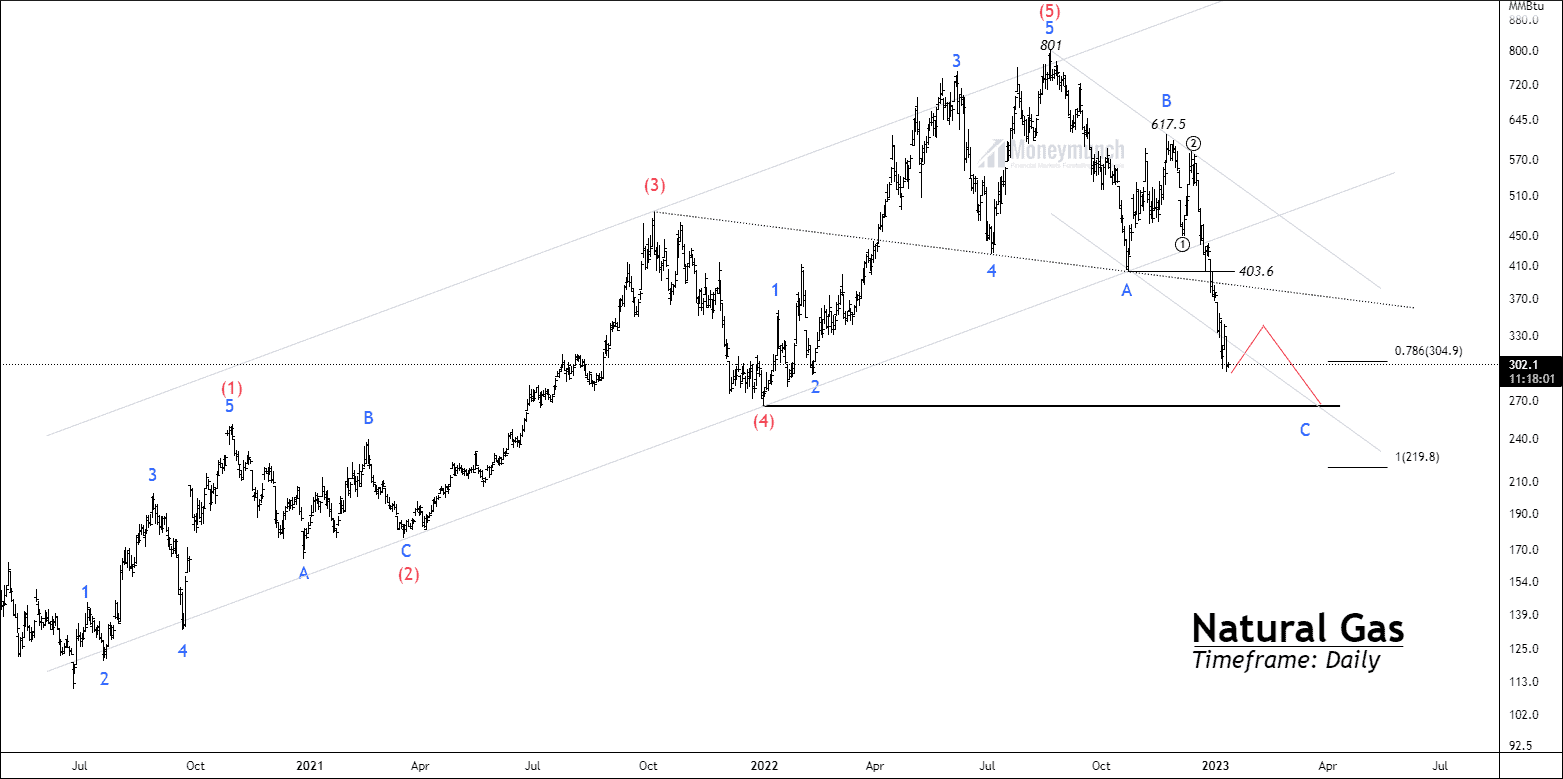
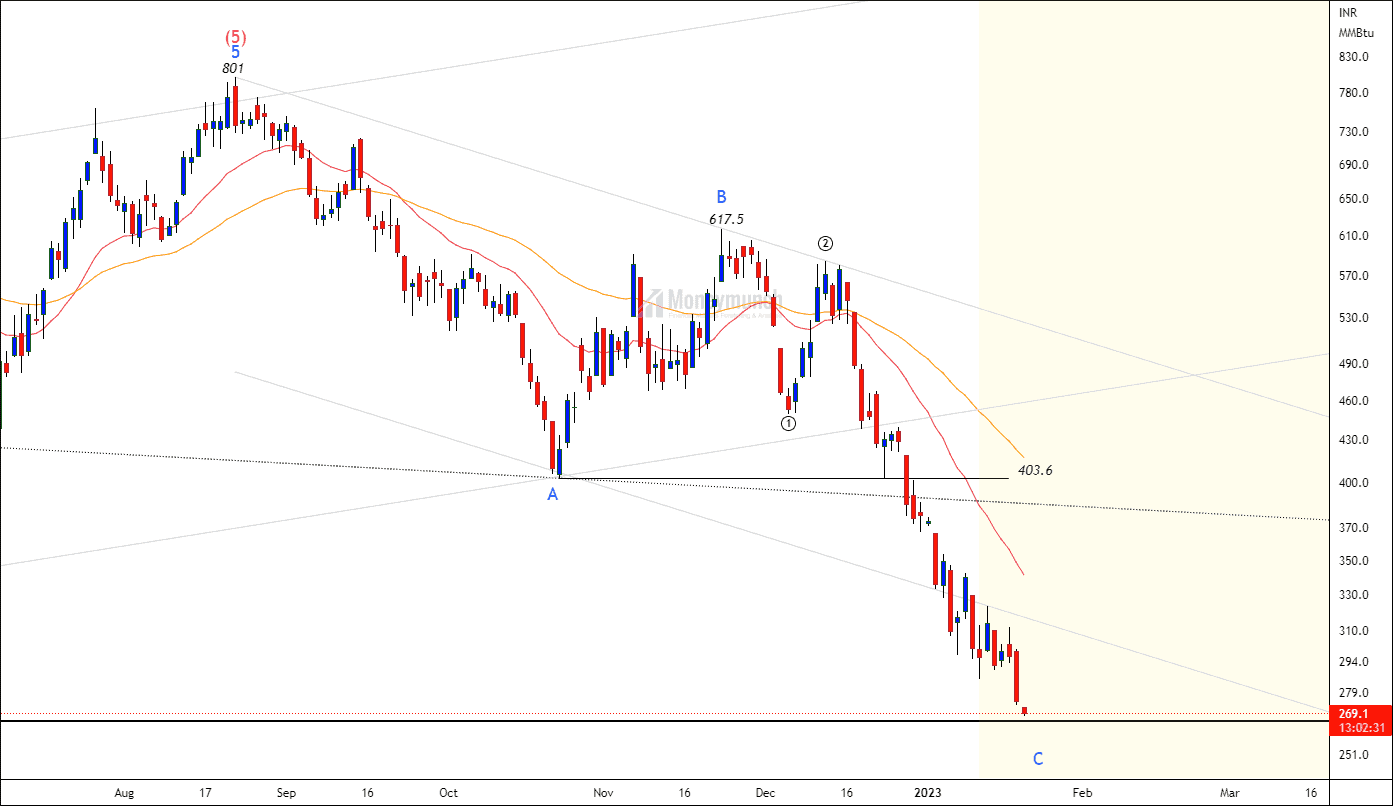
In our previous article, we discussed impulsive wave C and its continuation. On 20 January 2023, Price achieved our all given targets.
Click here: MCX Natural Gas – Elliott Wave projection
 Continue reading
MCX Natural Gas – Tips & Updates
Do you remember MCX Natural Gas Wave Analysis?
Click Here: MCX Natural Gas – Elliott Wave projection
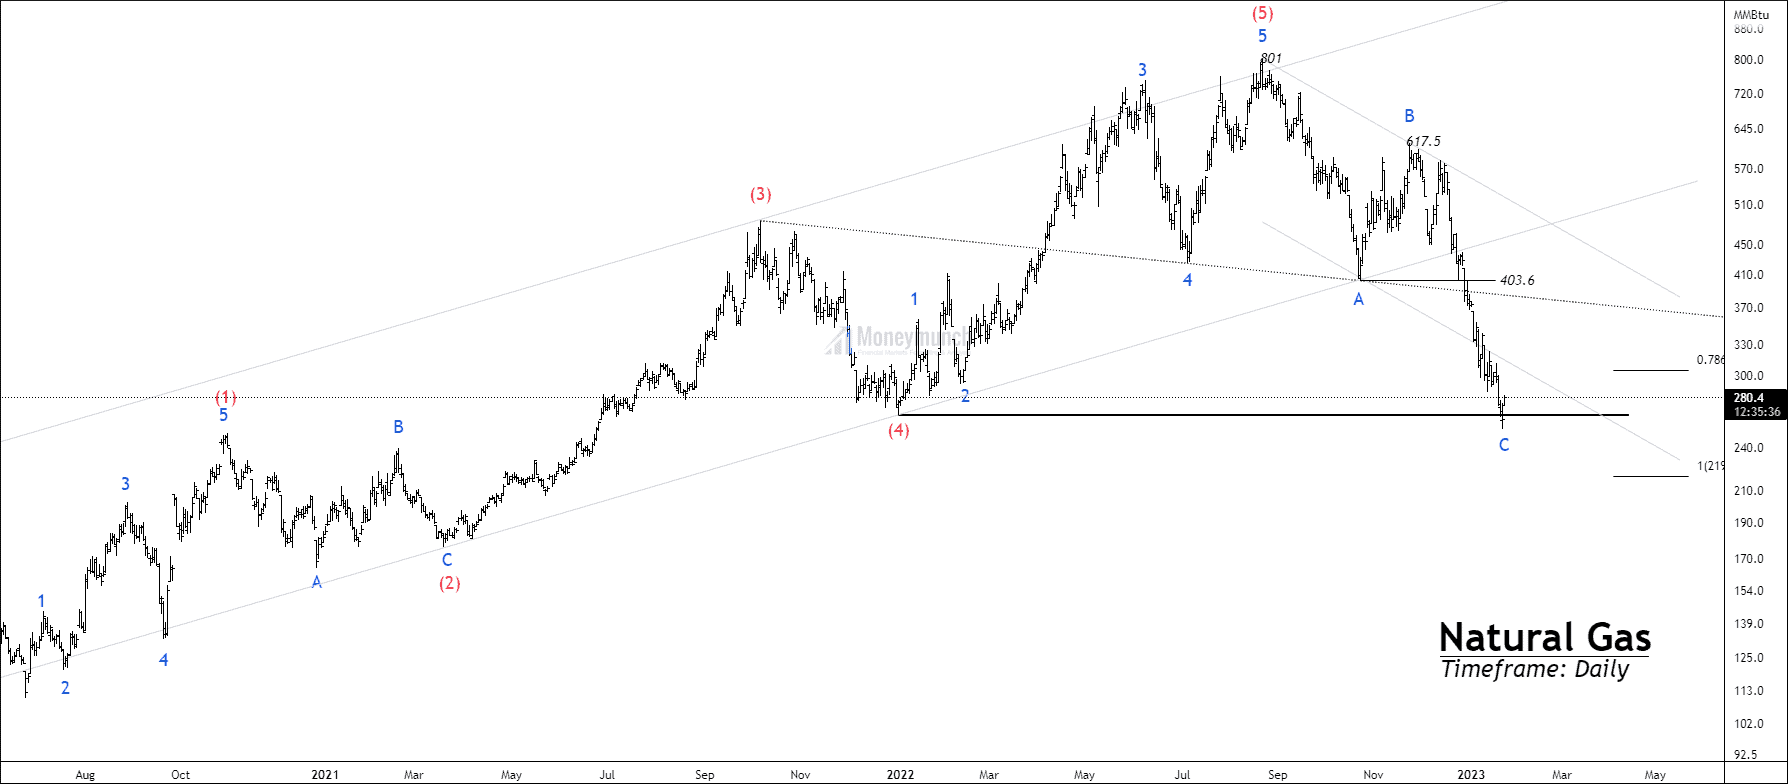
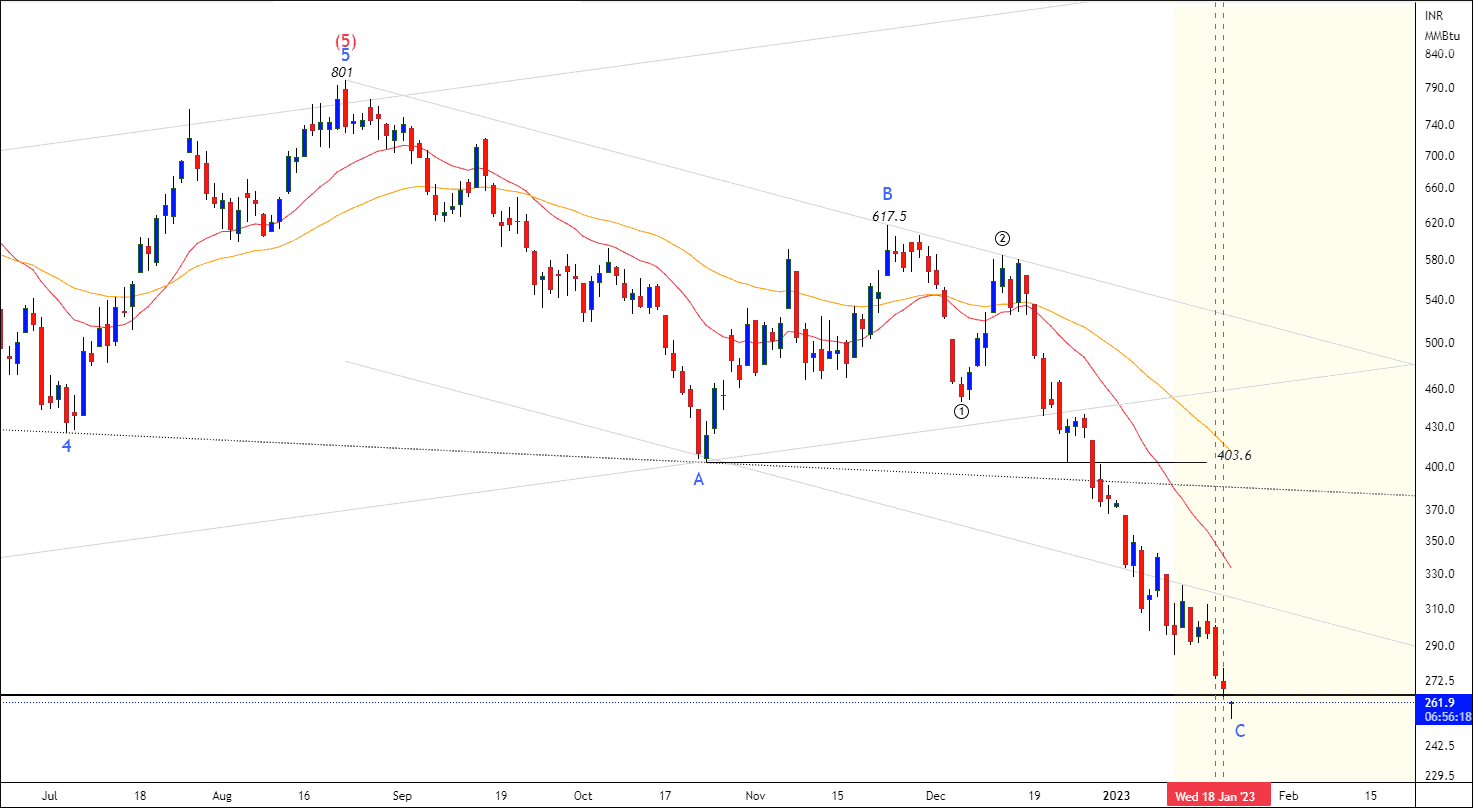
 BEFORE
I have written clearly, “If the price sustains below the lower band of the channel, traders can expect the following targets: 288 – 275 – 267.”
 AFTER
AFTER
MCX Natural Gas – Tips & Updates
Do you remember MCX Natural Gas Wave Analysis?
Click Here: MCX Natural Gas – Elliott Wave projection
BEFORE
I have written clearly, “If the price sustains below the lower band of the channel, traders can expect the following targets: 288 – 275 – 267.”
 AFTER
AFTER