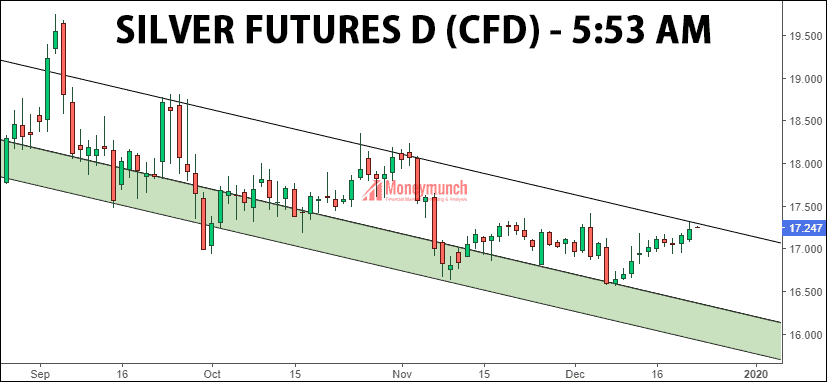
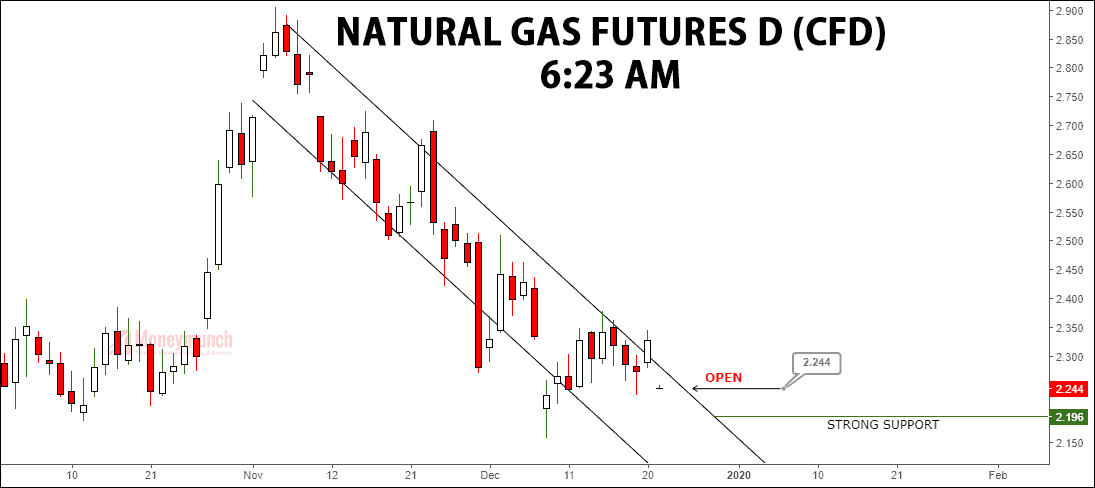
Is it right time to Buy or Sell?
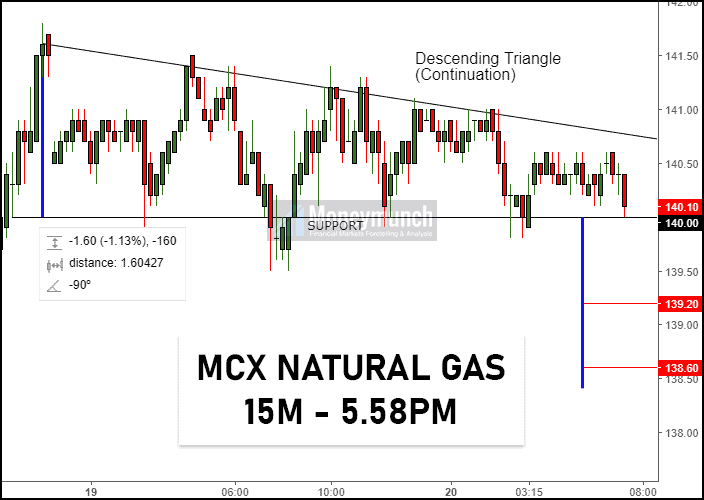
Don’t SELL after Resistance line breakout. Accurate entry-level, stop loss and targets available below.
 Unlock This Article
Only subscribers can read the full article. Please login to read the entire article.
To become a subscriber, subscribe to our free newsletter services. Our service is free for all.
Continue reading