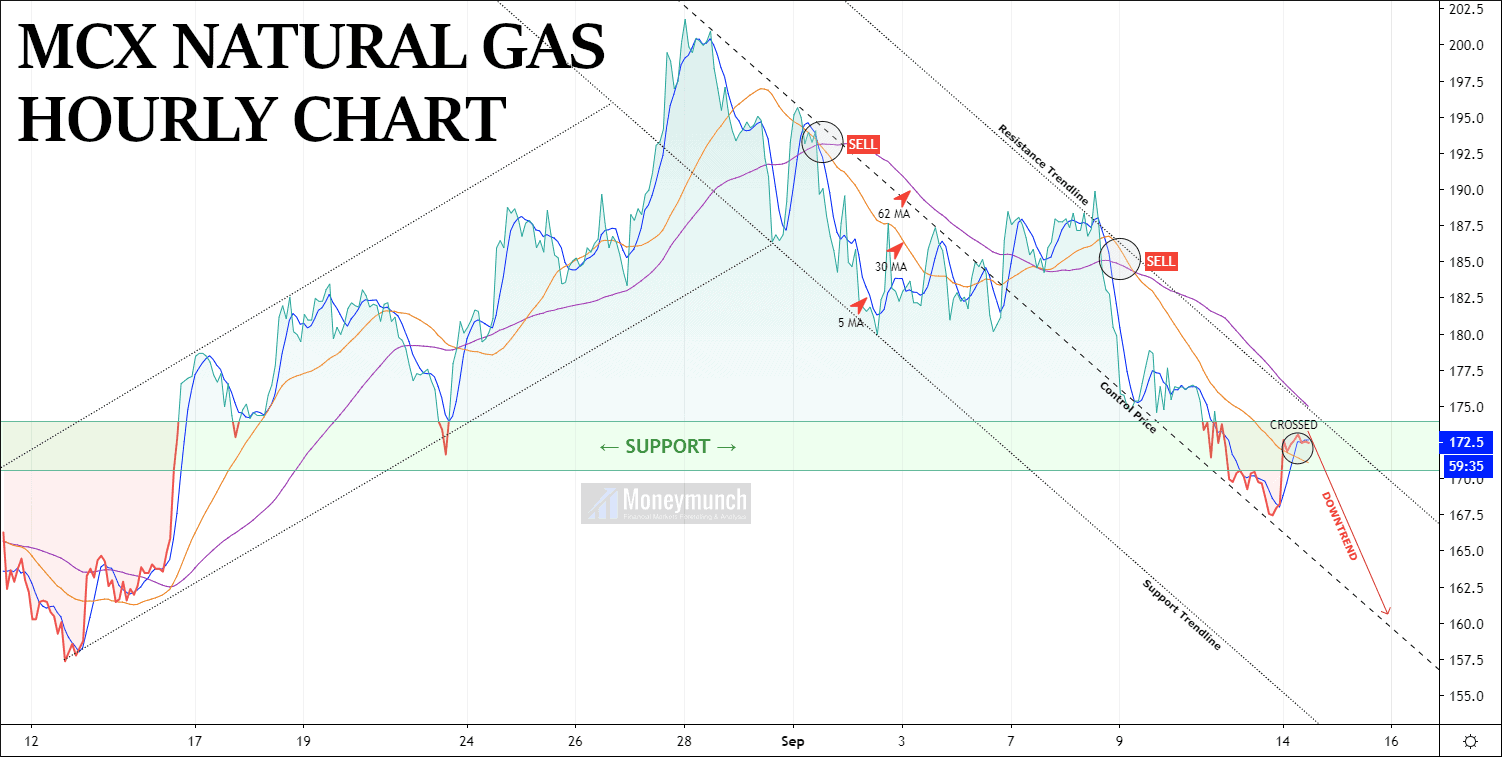
On the chart above, we have plotted three different MAs on the 1-hour chart of Natural gas futures. As you can see, the 62 MA is indicating a downtrend ahead. And 5 MA & 30 MA are crossing each other for a reversal. This reversal can be for 174 to 180 levels.
But according to the support & resistance trend line, we may see continue price collapsing.
I have also highlighted a support area with green color. Particularly, from this point, it’s taking a U-turn.
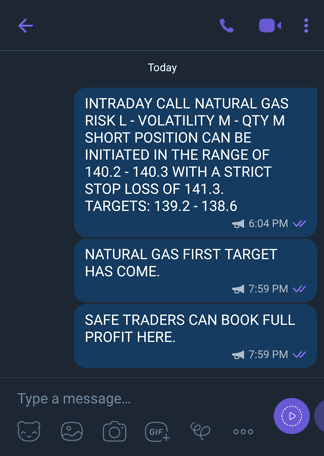
For safe traders, short positions can be initiated after 170 levels.
Targets: 167.6 – 165 – 162.6 – 160
To become a subscriber, subscribe to our free newsletter services. Our service is free for all.
Continue reading