 Unlock This Article
Only subscribers can read the full article. Please login to read the entire article.
To become a subscriber, subscribe to our free newsletter services. Our service is free for all.
Continue reading

Looking for reliable and free stock tips? Look no further than Moneymunch! We provide intraday and positional trading calls, technical analysis, research reports, and daily or weekly charts to help you make informed trading decisions in the stock market. Subscribe now and stay ahead of the game!
To become a subscriber, subscribe to our free newsletter services. Our service is free for all.
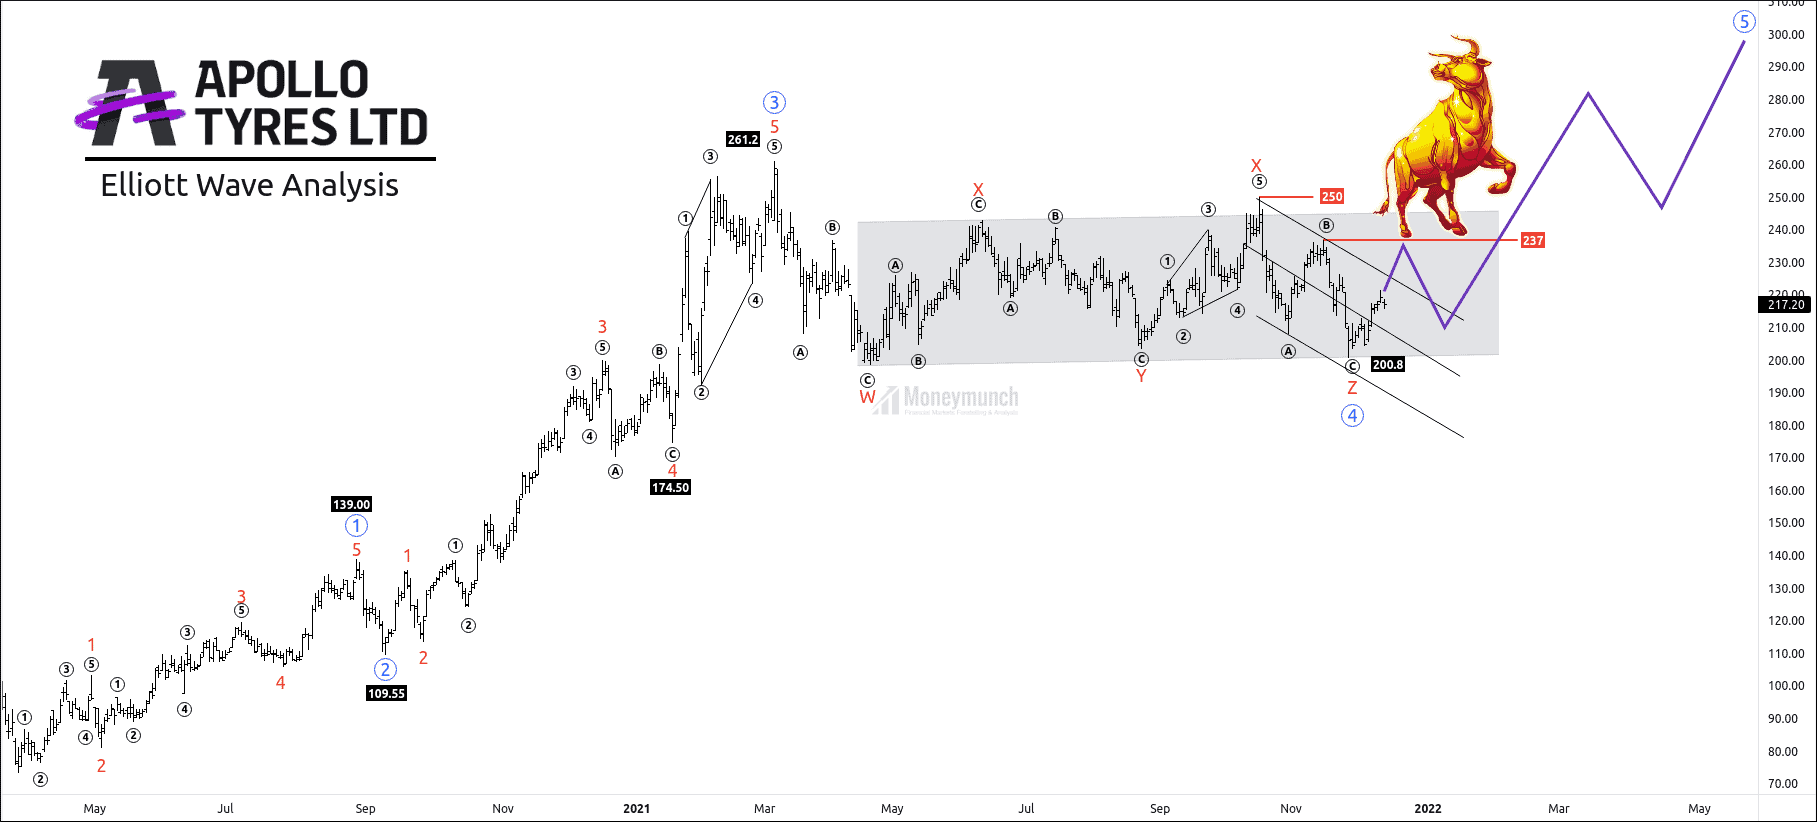
APOLLOTYER is preparing for a bull run. After completion of the 3rd wave at 261.2. Price had started a corrective wave ((4)) and took 38 weeks to finish this structure.
A trader can trade impulsive wave ((5)) to make a high confidence trade setup.
Wave Formations and Fibonacci relationships:
Wave ((1))is an impulse with a 5-3-5-3-5 wave structure.
Wave ((2)) is a zigzag move. Fibonacci retracement of wave 2 is 50% of 1st impulsive wave at 109.55. Sub-wave of wave 2 fulfilled the rule of equality (wave A= wave C)
Wave ((2)) is not exceeding the starting point of wave 1.
Wave ((3)) is an extensive impulse. 3rd wave has 261.8% retracement of 1st impulsive at 261.
Wave ((4)) is a triple three with a 3-3-3-3-3 wave structure.
It retraced 38.2% of the 3rd wave and did not overlap the starting point of wave 1.
What will happen next?
Completion of sub-wave z indicates that the corrective wave has ended. Price has started forming sub-waves of wave 5.
The sub-wave z of wave ((4)) has formed a descending channel.
If the price breaks descending channel and close above sub-wave ((b)) at 237, it will confirm the impulsive behavior.
(Note that the ending point of the corrective wave is the starting point of an impulsive wave.)
A trader can expect the following targets: 237 – 250 – 279 – 297+
Target 1: 237
[Clusters: high of wave B, the breaking point of the channel, 61.8% of reverse Fibonacci retracement of wave 4]
Target 2: 250
[Clusters: 78.6% reverse Fibonacci retracement of wave 4, high of wave X]
Target 3: 279
[Clusters: 38.2% of reverse Fibonacci retracement of wave 4, 50% Fibonacci extension of wave 1 through 3]
Target 4: 297+
[Clusters:161.8% of reverse Fibonacci retracement of wave 4, 50% Fibonacci extension of wave 1 through 3]
The safe traders can wait for the breakout of wave X.
If the price fails to break the wave X, correction is about to make a new leg down.
They can enter on the pullback to enter where they can manage risk with tight stop loss.
Invalidation: pullback can’t break the low of wave ((4))
Nifty has exactly performed as I described on the 13 Dec hourly chart. First, click the below link to read that Nifty Tips again:
Nifty is technically short-term bullish, but
First, nifty has touched the first three upside targets on the same day. And It has started collapsing to break downward targets of 17465-17408-17312.
Today nifty has made a low of 17225.8 and completed all targets. What’s next? I will update you soon.
To become a subscriber, subscribe to our free newsletter services. Our service is free for all.
To become a subscriber, subscribe to our free newsletter services. Our service is free for all.
Preface:
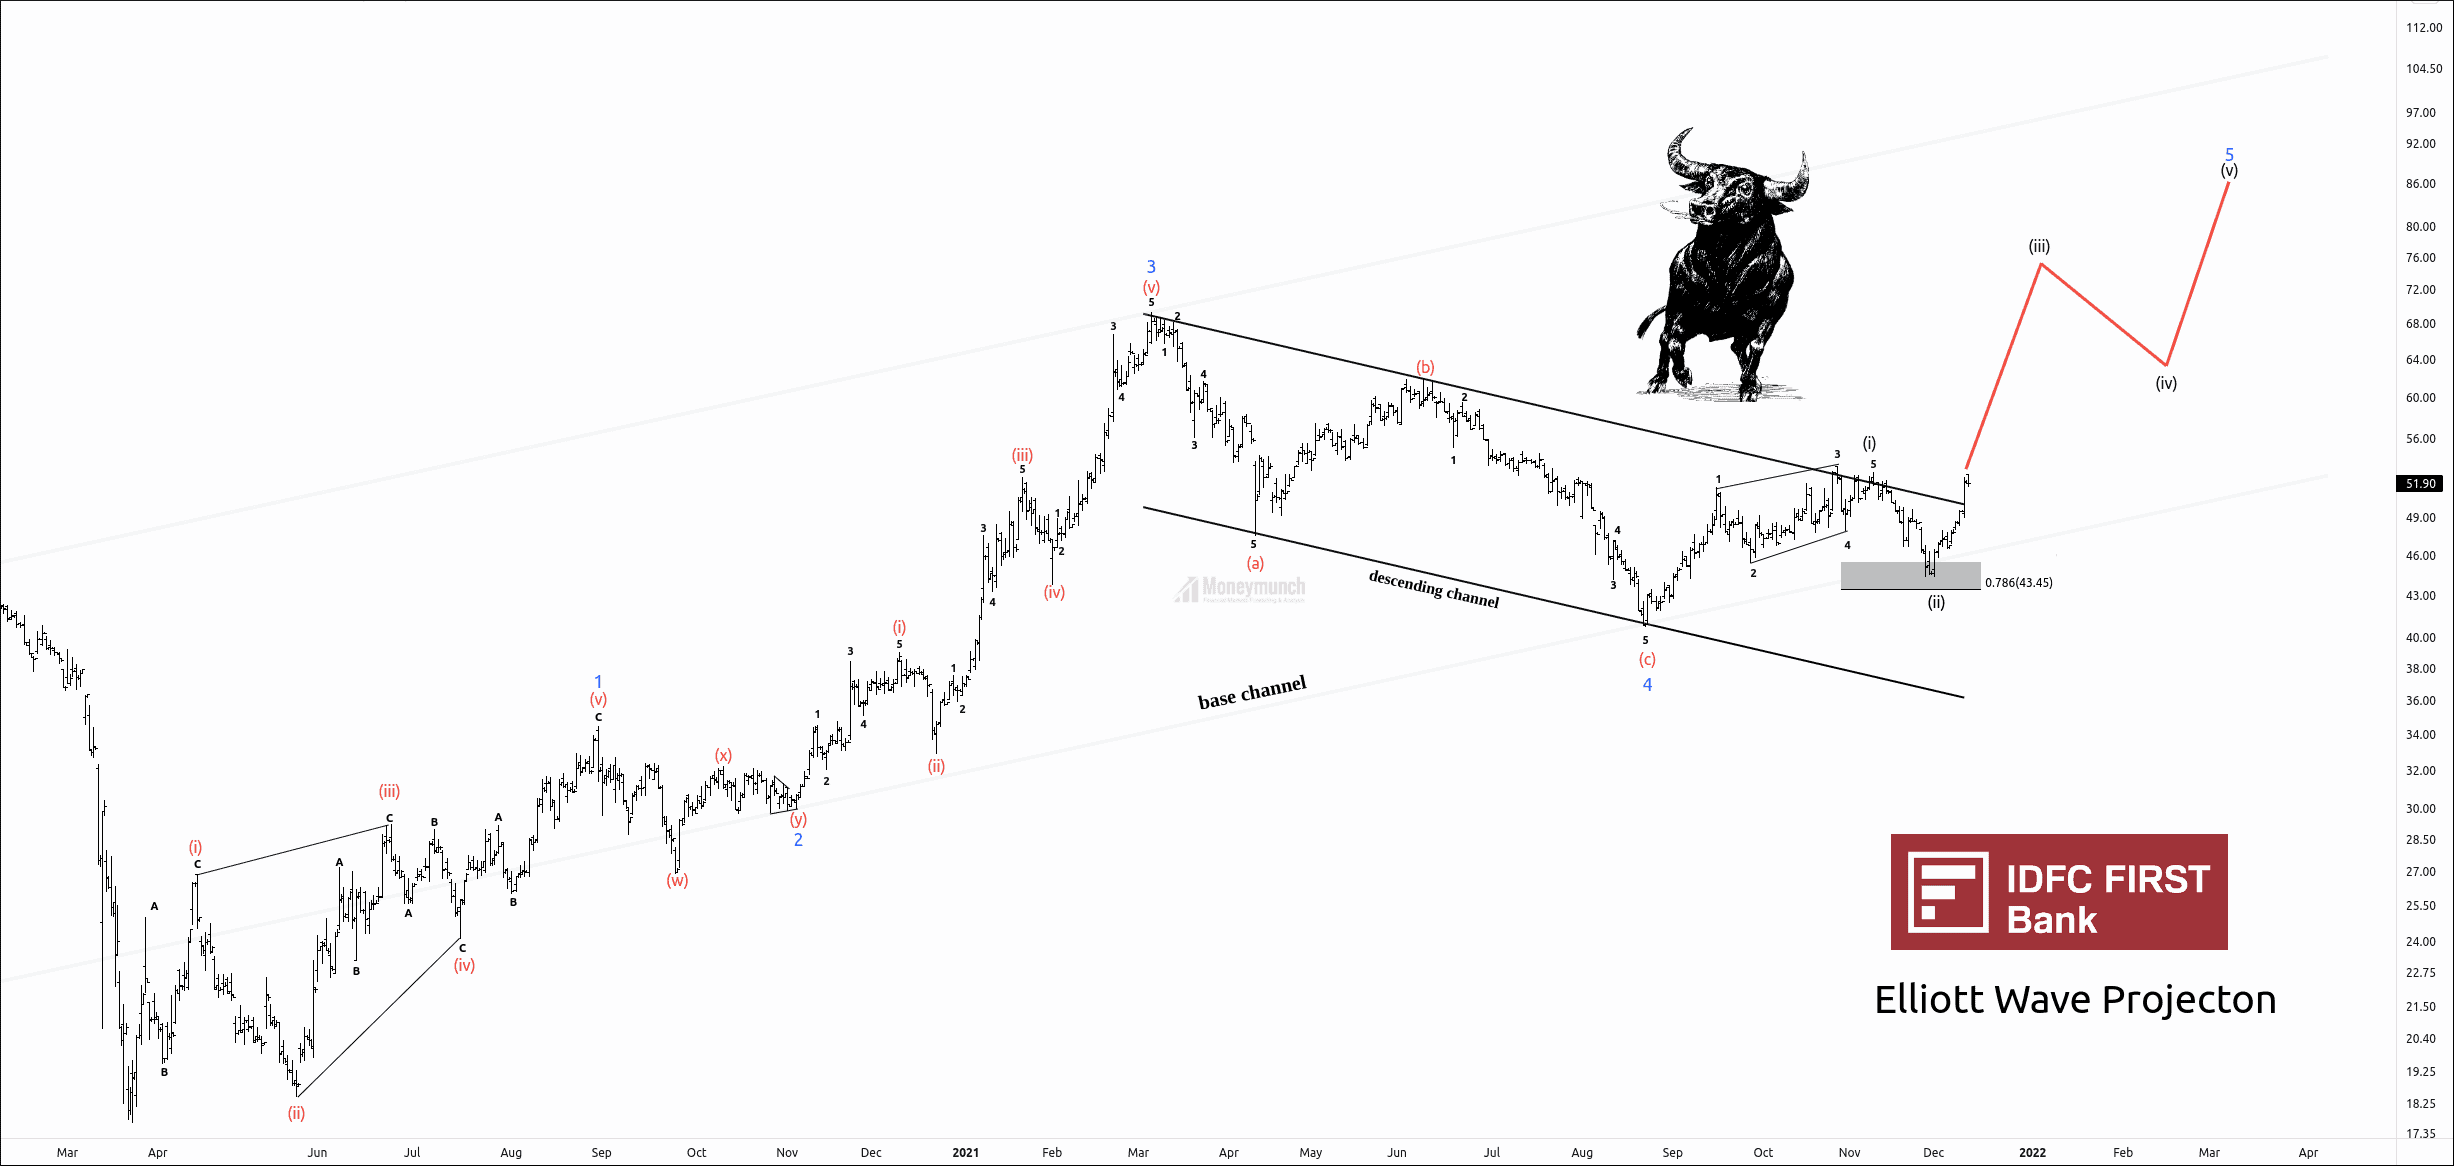
IDFC First bank is ready to march upward. After making the high of 69.30, the Price has started the corrective wave four and took 179 days to complete. The ending point of wave 4 is the starting point of impulsive wave 5.
Wave Formations and Fibonacci relationships:
Wave 1 is a Leading diagonal which has a 3-3-3-3-3 sub-wave structure.
Wave 2 is a combination where wave ‘W‘ is a zigzag & wave ‘Y‘ is a triangle. Fibonacci retracement of wave 2 is 38.2% of wave 1.
Wave 2 is not exceeding the starting point of wave 1.
Wave 3 is an extensive impulse. 3rd wave has 261.8% retracement of wave 1.
Wave 4 is a zigzag correction with a 5-3-5 wave structure.
Sub-wave of wave 4 fulfilled the rule of equality (wave A= wave C).
Wave 4 retraced 78.6% of wave 3.
What will happen next?
Completion of sub-wave C indicates that the corrective wave has ended. Price has started forming sub-waves of wave 5.
Wave (ii) retraced 78.6% of wave (i).
If the IDFC First Bank breaks the high of wave 1, it will confirm the impulsive behavior of wave (iii).
(Note that the ending point of the corrective wave is the starting point of an impulsive wave.)
A trader can expect the following targets: 64-74.64- 86.2+
Target 1: 64
[Clusters: high of wave B,161.8% of wave (iii), 78.6% of reverse Fibonacci retracement of wave 4]
Target 2: 74.64
[Clusters: 2.618% of wave (i) through (iii), 161.8% of wave 1 through 3]
Target 3: 86.23
[Clusters: 78.6% reverse Fibonacci retracement of wave 4]
I have also recommended this stock for a portfolio on Nov 24. Here, 8 Indian Stocks That Can Turn 1 Lakh Into 10 Lakh by 2030
UPDATE: Today I have updated Nifty (Nifty technically short-term bullish, but…). It’s all target done after opening the bell.
To become a subscriber, subscribe to our free newsletter services. Our service is free for all.
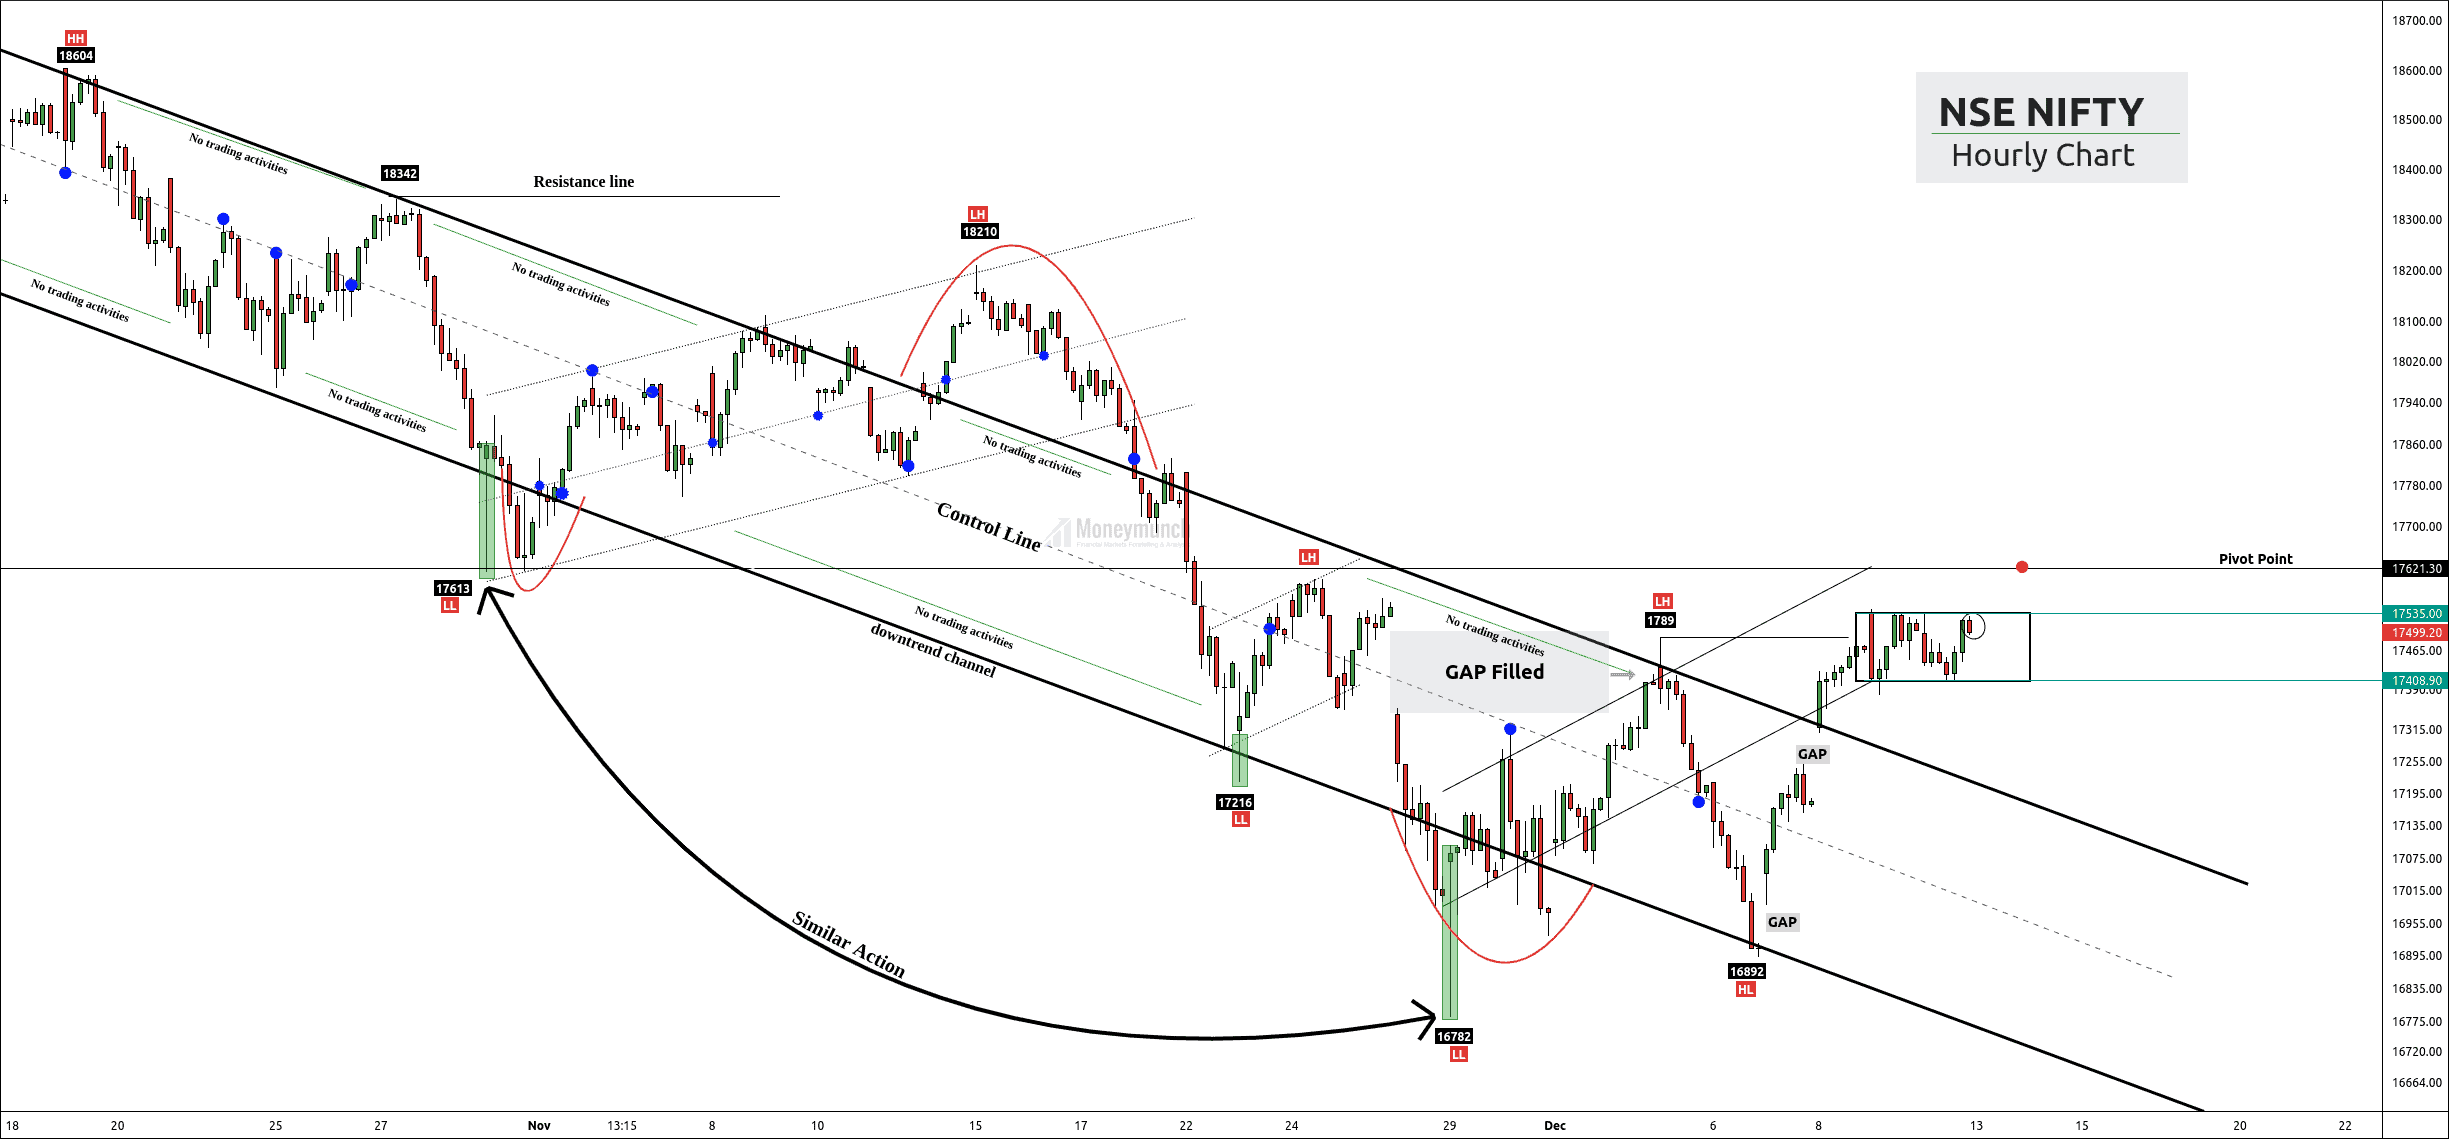
Nifty hasn’t given a continuous breakout of the lower high. If nifty couldn’t give consecutive closes above lower high, there can be a failed swing low and signals resumption of the trend.
In 30-minute timeframe, the price has made a value area box where supply equals demand. If nifty gives a continuous break to the upper band of the value area, traders can initiate a buy position for the target of 17554-17586-17618.
Strong closes above 17621 indicate a good time for bull traders.
Swing failure may drive the price lower. Bear traders can look for 17465-17408-17312.
To become a subscriber, subscribe to our free newsletter services. Our service is free for all.
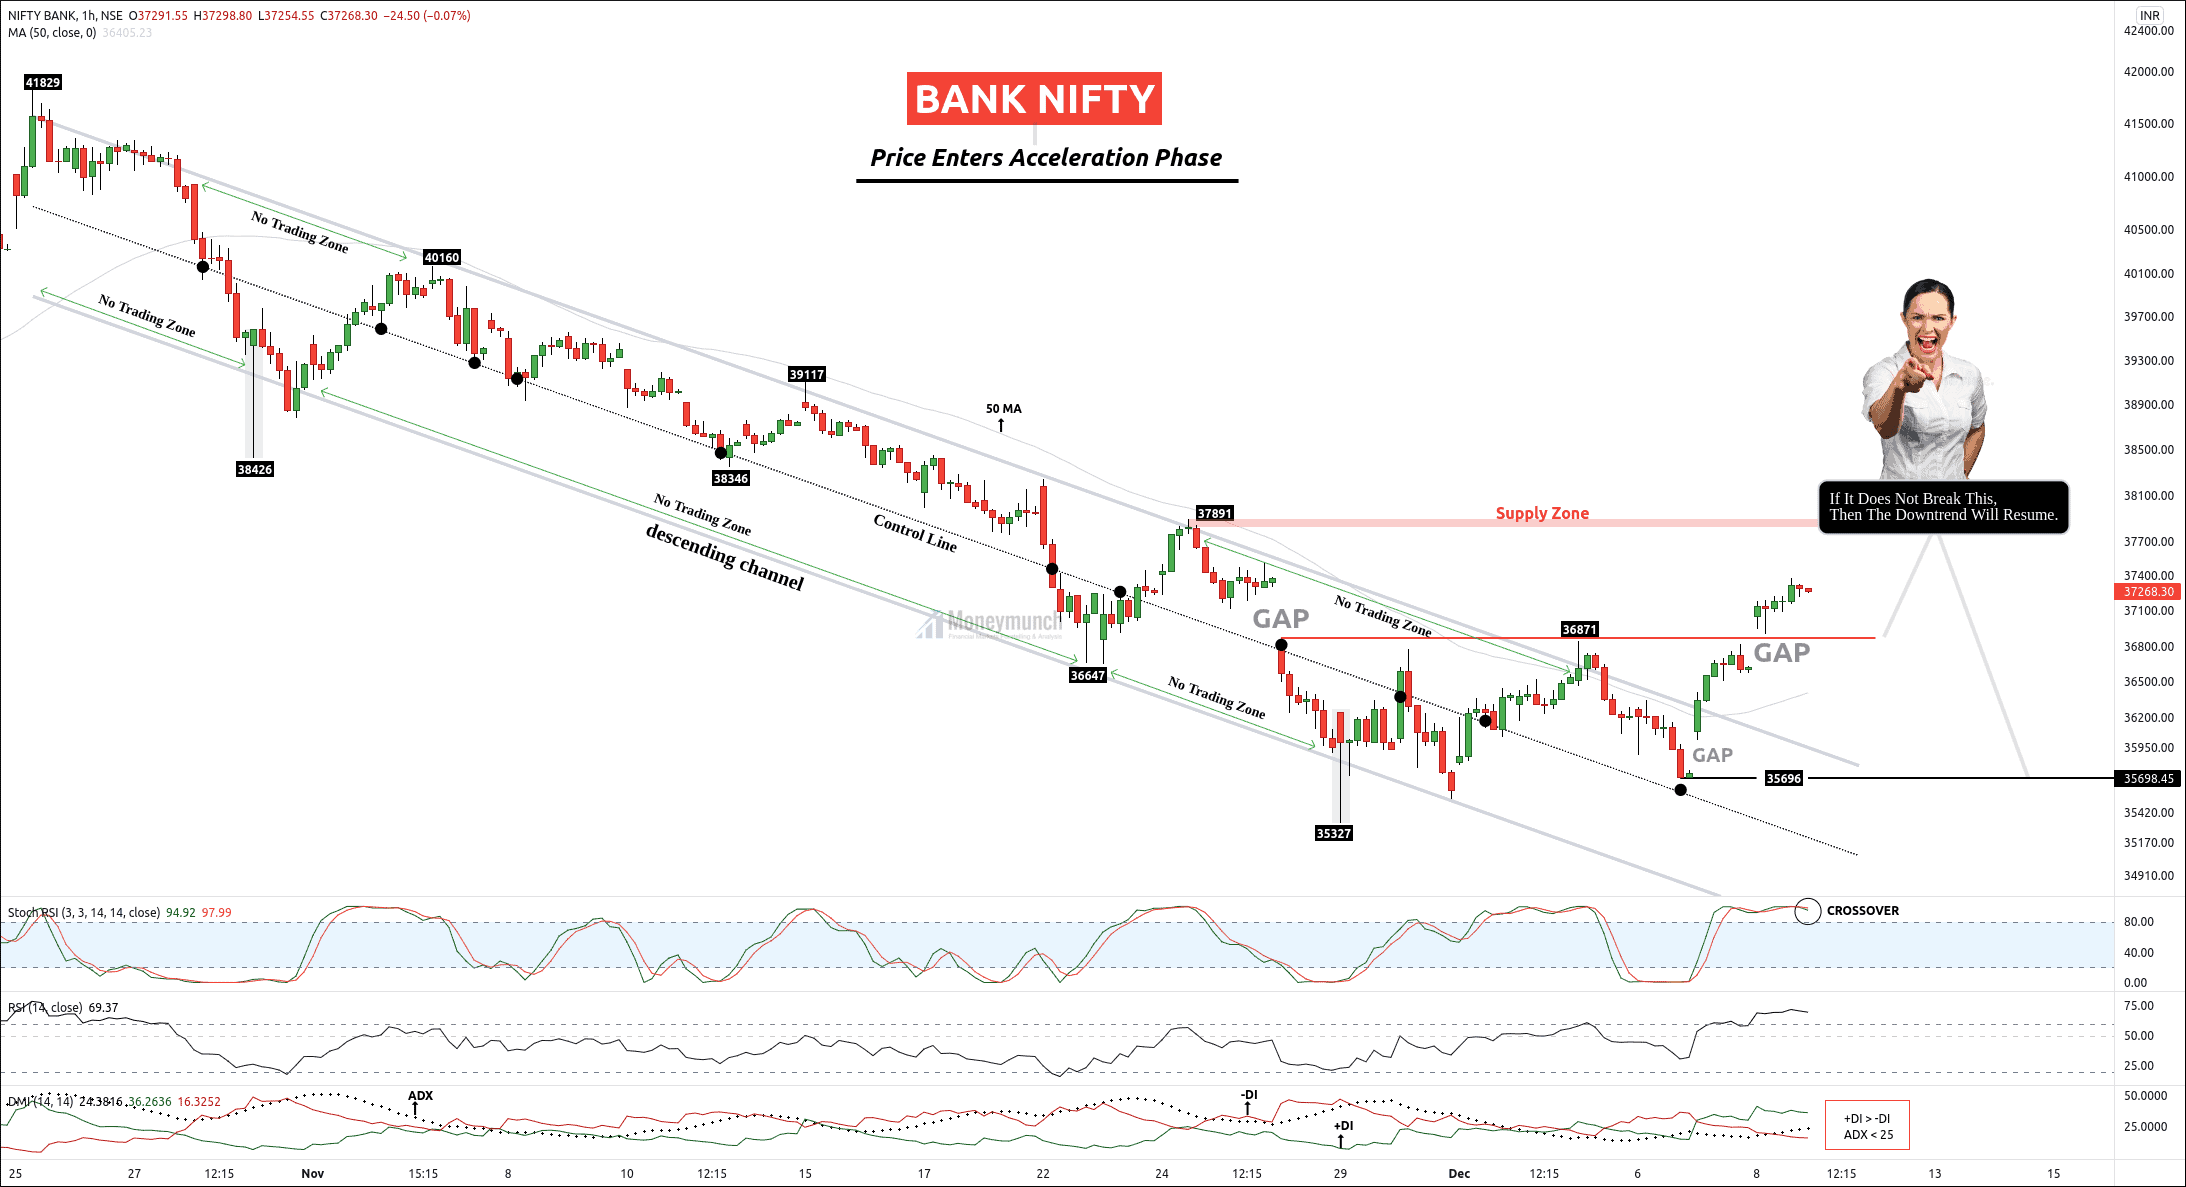
Bank Nifty had stuck into the descending channel (DC) from 25 Oct to 07 Dec. The upper trendline of DC has broken and started moving forward. It has filled the 25 Nov gap yesterday and marching towards the supply zone. We have chances to see 37600 – 37800+ levels today. Intraday traders can take benefit of it.
But you must note the second resistance of 36871. It’s a barrier for buyers. If Bank Nifty remains under of it, then we may see an excess of this channel. And that will collapse the Bank Nifty prices from 36800 to 36300 – 35696 below. That’s why I have highlighted the supply zone in the above chart with a strict warning.
I have used RSI and Stoch RSI together. The Stoch RSI is indicating a downtrend ahead. But, others (MA, DMI, & RSI) are throwing positive signs. Hence, you have to focus on the second resistance line only.
To become a subscriber, subscribe to our free newsletter services. Our service is free for all.