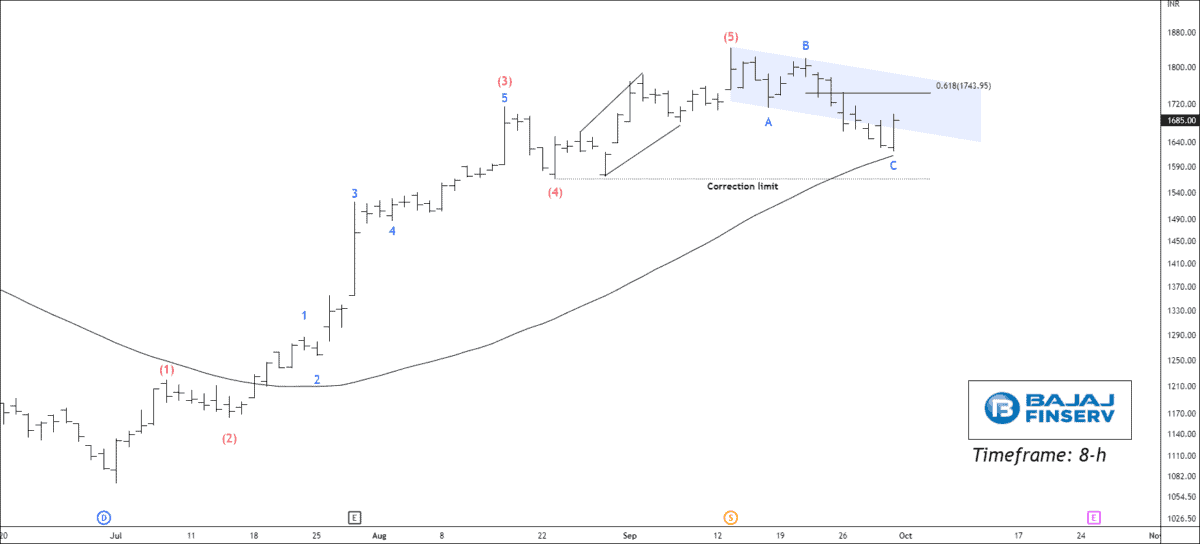
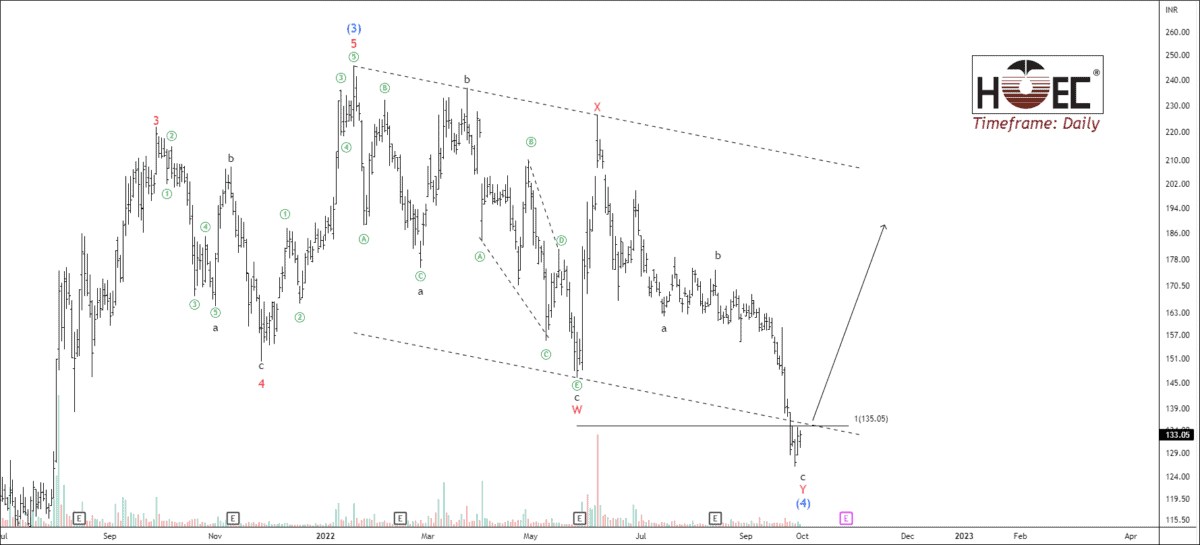
NSE HINDOILEXP: Bull Trap or A Systematic Rally
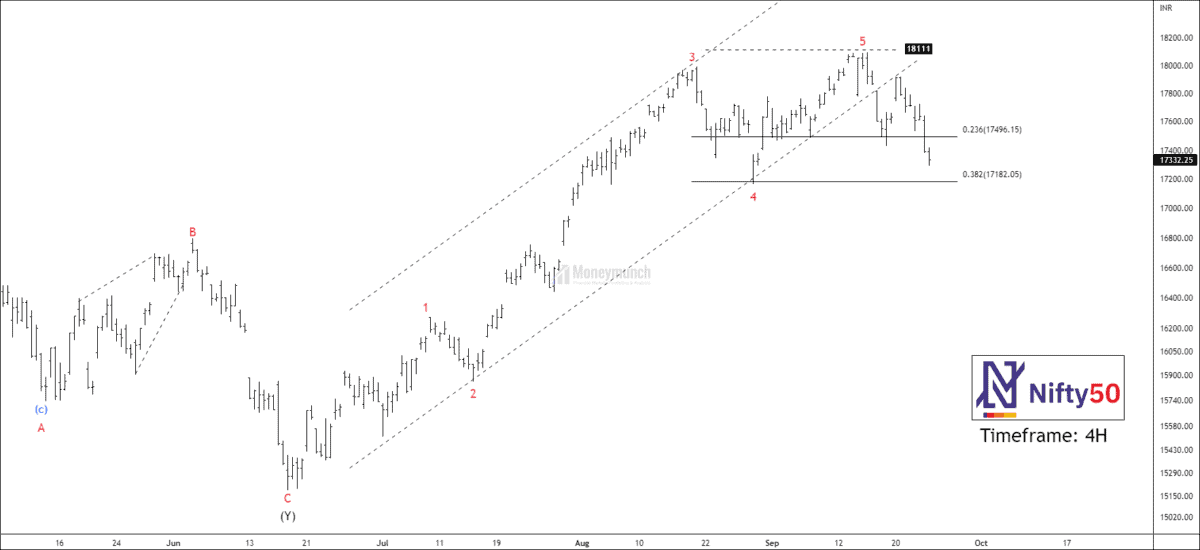
NSE NIFTY: Marching Towards Pivot Zone
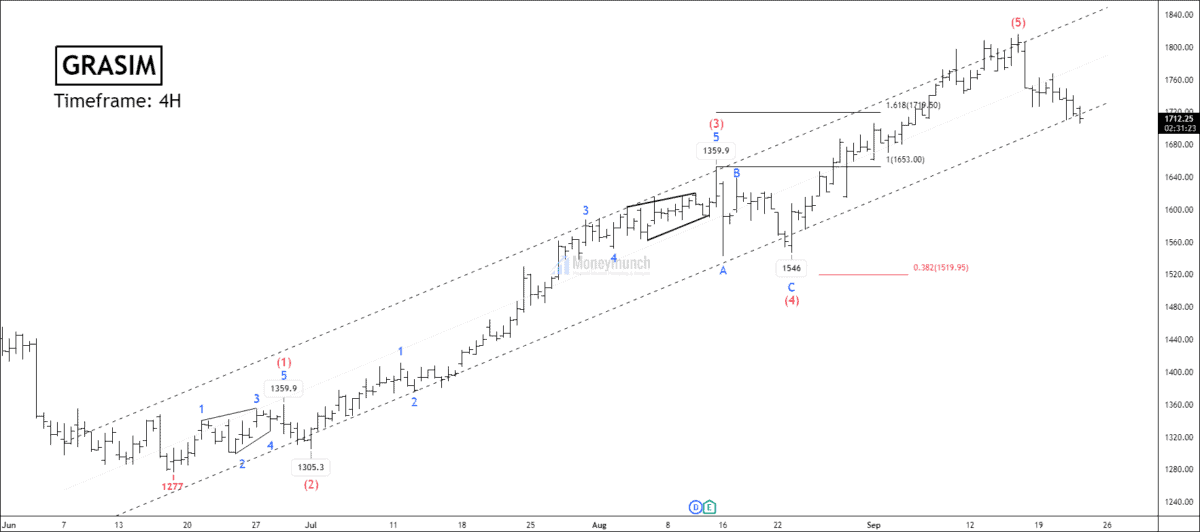
NSE GRASIM: Elliott Wave Projection
NSE NIFTY High Confidence Trade Setup
 Unlock This Article
Only subscribers can read the full article. Please login to read the entire article.
NSE MRF Elliott Wave Projection For Subscribers

Only subscribers can read the full article. Please login to read the entire article.